

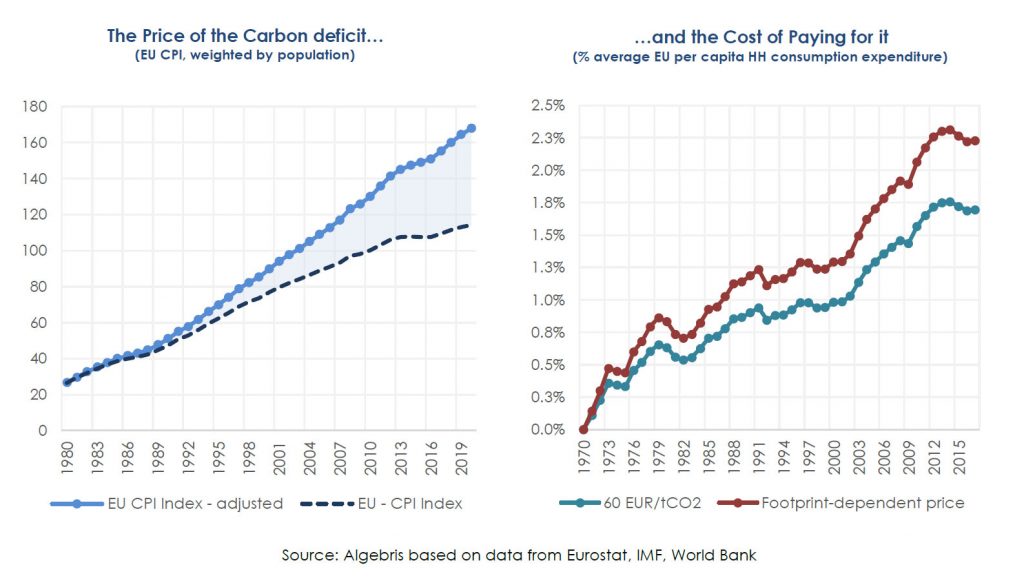
Had the CPI included the cost of paying for our growing CO2 emissions the price level today would be 50% higher than it is estimated to be.
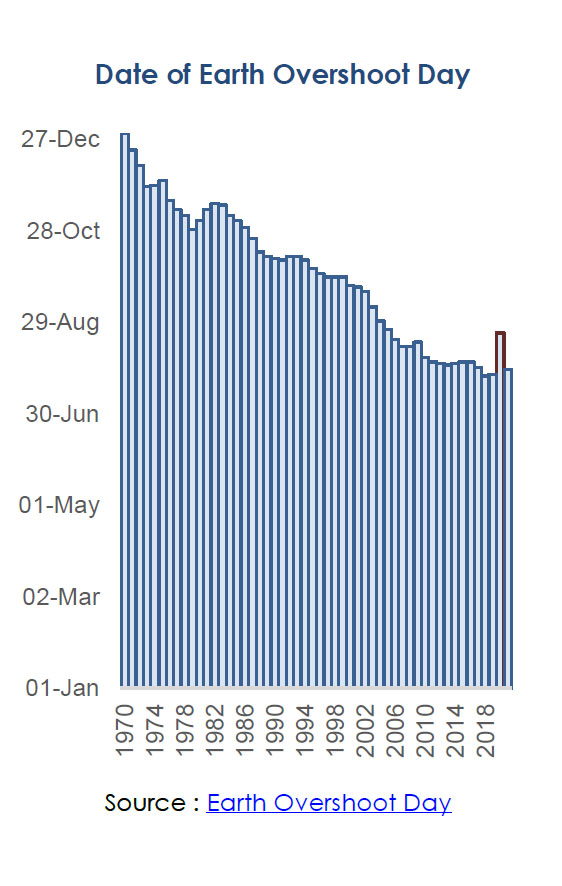
Humans have been living well beyond their (planetary) means. Every year, Earth Overshoot Dayi marks the date when our demand for ecological resources and services exceeds Earth’s biocapacity, i.e. what the planet can regenerate in the same year. In 2021, the date fell on July 29th – meaning that our ecological footprint in the first seven months of the year was large enough to exhaust Earth’s entire annual regeneration capacity. Humans will require almost 2 planets-worth of ecological resources to meet our demand for 2021. The last year when we consumed only what Earth could regenerate was 1970. Ever since then, humanity has been running a growing biocapacity deficit. If we wanted to deleverage the debt we accumulated vis-à-vis our planet, it would take 14.5 years during which we demand nothing from it. Economic theory tells us that persistent deficits should fuel inflation, but our biocapacity deficit has not been reflected in higher prices. We have not had to pay for it yet, but we will soon need to. What will ‘climate inflation’ look like, then?

How would prices have been affected by our biocapacity deficit, if the good that we have been over-consuming (CO2) had not been priced at zero?
Intuitively, there is only such an amount of resources we can consume without reducing Earth biocapacity. Above such level, consumers should be charged, as it happens in every other market. Policy makers and global corporates are already taking steps in this direction, via emission taxes and net zero policies. The question thus becomes: how much will CO2 weigh on consumer spending, as this process of internalization proceeds?
We find that consumers would have borne a significant cost over the past 50 years – in the order of an annual average 1% of per capita EU household consumption expenditure – if they had been made to pay for our growing CO2 deficit. Had this effect been incorporated into prices, the EU Consumer Price Index (CPI) would be about 50% higher today than it is estimated to be.
The Planetary Boundaries (PB) framework offers a simple way to think about this, by defining a global ‘safe operating space’ for human activity outside of which the risk of large-scale, abrupt or irreversible environmental change increases. In the case of carbon, our planetary boundary is a limited budget of total Global Greenhouse Gas (GHG) emissions. The budget we have left at the global level is currently ~550 Gt CO2 for staying below 1.5°C of warming, or 1000 Gt CO2 for staying below 2°C. For the EU, the budget is 40 – 70 Gt CO2ii.
Back in 1970 – the last year when our carbon budget was balanced – our GHG emissions were 14 Gt CO2, the same level we should reach by 2050 to keep temperature increase below 1.8°C. If any emission in excess of that sustainable level had been priced at 60 EUR/tCO2 , with full pass-through to products pricesiii, the annual cost of paying for our growing carbon deficit would have been equal to ~0.4% of the per capita household consumption expenditure, for the average OECD consumer. For the average EU consumer, the cost would have been more than twice as much (~1%). Absent a change of behaviour (i.e. assuming, somewhat implausibly, that pricing emission would not have led to a progressive reduction of our carbon deficit) the cost would have grown over time to 0.7% of consumption expenditure for the average OECD consumer and to 1.7% for the average EU consumer. The cost of paying for emissions would have therefore increased much faster than consumption expenditure, which roughly doubled over the past 50 years. If we assumed a higher price for higher-footprint goods, rather than a uniform price of 60 EUR, the effect in proportion of consumption expenditure would be largeriv.
Another way to get to the (same) result is by computing a ‘shadow price’ for the consequences of our over-consumption. This price has three components: (i) scarcity; (ii) risk; and (iii) policy.

Over the past 50 years, we have been consuming without accounting for the cost of depleting scarce natural resources. The UN expects global resource extraction to grow to 190 billion tons by 2060. To remain in a sustainable scenario, we need to reduce this by 25%. With price elasticity being around -0.35v, achieving such a large reduction in consumption would require prices to increase by as much as 70-75%. The cost for the average European consumer would increase by 0.9% per yearvi.
Another hidden cost of our biocapacity deficit is in the increased physical risk, arising from more frequent and severe weather extremes and natural disasters (such as recent floods in Germany or wildfires in California). Physical risk may affect prices through higher insurance premiums, and supply chain disruptions may become more frequent due to damages in physical capital from natural distasters. As we are seeing in the case of COVID-19, these supply side shocks tend to be inflationary. Going forward, we may be facing more of them and they could be getting worse. Overall, the ECB estimates the impact of increased physical risk on inflation to range between 0.05% and 0.5% annually, depending on whether the transition will be orderly or disorderly.

Policy is pushing for the internalization of the externalities we have not been pricing so far, by setting emission reduction paths and ambitious net zero targets. In the short run, emissions will get more expensive. To achieve its GHG emissions reduction target for 2030, the European Commission plans to speed up the gradual reduction in the overall number of emission allowances in its Emission Trading System (ETS). Assuming an emission price ranging between 30 and 60 EUR/tCO2, paying for the emissions in excess of those compatibel with a 1.5° warming path would add an extra 0.16%-0.32% to prices in Europe.
At the same time, the spikes in energy costs that we are experiencing in 2021 could become more frequent. Renewable energies are volatile – as windpower generation and droughts interfering with hydropower output have recently shown – and natural gas and coal still make up to 40% of electricity sources in Europe. Demand for natural gas is bound to increase as more emerging markets start transitioning out of coal, and with nuclear energy still a taboo in many countries, this could lead to more frequent spikes in energy prices. While we do not try to estimate the price volatility connected to the transition here, it is worth noticing that as the change in the energy mix will take time to materialise we can expect demand imbalances to become more important in shifting energy prices compared to the past.
Central banks have struggled for years to reach their 2% inflation target. Our results suggest that allowing the CPI basket to include a price for emissions would have done half of the job. Emission-related inflation would have trumped the contribution of energy inflation in Europe over the past 20 years, as the difference bettween headline and core was on average 0.75%. As the global economy moves towards a new phase of higher inflation, policies of gradual internalization of externalities that we have not been paying for suggest a new source of inflation that central banks will need to acknowledge: climate inflation. Milton Friedman famously said that inflation is a monetary phomenon. The green transition may show us that inflation is becoming a physical phenomenon that leads to a monetary one.
Additional reading
EEA (2020) – Is Europe living within the limits of our planet? An assessment of Europe’s environmental footprints in relation to planetary boundaries. Joint EEA/FOEN Report
ECB (2021) – Climate Change and Monetary Policy in the Euro Area. Occasional Paper Series No. 27/2021
European Commission (2015) – Ex-post investigation of cost pass-through in the EU ETS. An analysis for six sectors. CE Delft and Oeko-Institut
SERI et al. (2009) – Overconsumption? Our use of the world’s natural resources
Stockholm Resilience Centre (2018) – Technical Report. Operationalizing the concept of a safe operating space at the EU level – first steps and explorations.
UN (2019) – Global Resources Outlook 2019
Sources
Earth Overshoot Day
GHG emissions
UN Global Material Flows Database
Notes
i Earth Overshoot Day is calculated as: (Earth’s Biocapacity / Humanity’s Ecological Footprint) * 365. The unit of account for Ecological Footprint and the Biocapacity is Global Hectares Accounting (GHA). One GHA equates a unit of a biologically productive hectare (hence, different kinds of lands are weighted by their biological productivity and converted into common Global Hectares). As an example, in 2017 the total Environmental Footprint was 20,926,093,398 GHA while the planet’s Biocapacity was 12,066,837,591 GHA. The difference can be interpreted as a yearly deficit of resources that humanity consumes in excess of Earth’s biocapacity. For 2017, the ratio was 1.73 – suggesting that humanity consumed almost two planets-worth of resources to satisfy its 2017 needs. Both Environmental Footprint and Biocapacity are broken down into individual constituents (built-up land, cropland, fishing grounds, grazing land, forest products, and carbon). More information is available at: https://www.overshootday.org/about-earth-overshoot-day/
ii Based on an equal-per-capita allocation of the global CO2 emissions budget. See estimates in Stockholm University Resilience Centre (2018)
iii Estimates of the optimal price for carbon are subject to a lot of uncertainty, but recent research by several international organizations suggests a rough benchmark of 60 EUR/tCO2. The European Commission recently estimated that a carbon price of 60 EUR/tCO2 would be required to achieve its EU emission-reduction target of 55% by 2030, under a scenario that assumes an extension of the EU ETS to cover buildings, road transport and intra-EU maritime navigation sectors. The IMF proposed in 2019 a higher price of 75 USD/tCO2 globally to ensure meeting the Paris Agreement targets. Pass-through of carbon costs to product prices can be expected to be very high, so we assume 100% for simplicity.
iv Using EUROSTAT data on estimated carbon footprint at the product level, we can also adjust this very simple estimate by applying a higher price to those products in the consumption basket that have a higher carbon footprint (such as Food, Beverages and Tobacco, Electricity, Gas, Steam, and Air Conditioning). With a price of 100 EUR/tCO2 for high-footprint sectors and 60 EUR/tCO2 for the other sectors and applying weights equal to the monetary weight of different items in the consumption basket, the effect of paying for the carbon deficit on consumer expenditure is even larger.
v With estimates ranging between -0.1 and -0.6 (Chang et al, 2019; Duetsch, 1993; Anderson et al. 1997)
vi Typical price is 20 euro per 60kg (source: Sustainable Europe Research Institute – SERI), typical household consumption per capita in Europe is 18.5 kEUR/year.
Silvia Merler – Head of ESG & Policy Research
Gabriele Foà, PhD – Portfolio Manager, Global Credit Opportunities Fund
This document is issued by Algebris Investments (Ireland) Limited. It is for private circulation only. The information contained in this document is strictly confidential and is only for the use of the person to whom it is sent. The information contained herein may not be reproduced, distributed or published by any recipient for any purpose without the prior written consent of Algebris Investments (Ireland) Limited.
Algebris Investments (Ireland) Limited is authorised and regulated by the Central Bank of Ireland. The information and opinions contained in this document are for background purposes only, do not purport to be full or complete and do not constitute investment advice. Algebris Investments (Ireland) Limited is not hereby arranging or agreeing to arrange any transaction in any investment whatsoever or otherwise undertaking any activity requiring authorisation under the Financial Services and Markets Act 2000. This document does not constitute or form part of any offer to issue or sell, or any solicitation of an offer to subscribe or purchase, any investment nor shall it or the fact of its distribution form the basis of, or be relied on in connection with, any contract therefore.
No reliance may be placed for any purpose on the information and opinions contained in this document or their accuracy or completeness. No representation, warranty or undertaking, express or implied, is given as to the accuracy or completeness of the information or opinions contained in this document by any of Algebris Investments (Ireland) Limited , its members, employees or affiliates and no liability is accepted by such persons for the accuracy or completeness of any such information or opinions.
The distribution of this document may be restricted in certain jurisdictions. The above information is for general guidance only, and it is the responsibility of any person or persons in possession of this document to inform themselves of, and to observe, all applicable laws and regulations of any relevant jurisdiction. This document is suitable for professional investors only.
© 2021 Algebris Investments (Ireland) Limited . All Rights Reserved.
