

How is the COVID-19 situation evolving across countries while we await the mass rollout of vaccines next year? The Algebris Big Data & AI team presents our in-house developed data application to help track the pandemic trajectory and the corresponding changes in activity levels.
The app aggregates epidemiology, hospitalisation, and mobility data for 100+ countries, as well as US states and counties. Data is crawled from 100+ sources per the open source COVID-19 Open-Data project by Google which the team has been contributing code to.
Unlike other existing COVID-19 data apps, the Algebris COVID-19 Tracker offers several unique functionalities that help to directly answer questions that investors are most concerned about.
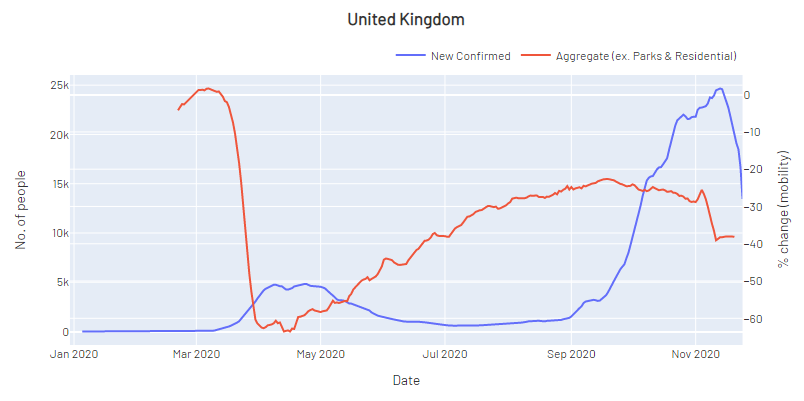
Firstly, the app plots mobility data alongside epidemiology data for each location, which helps to identify relationships between the growth of infections and the general amount of movement by the population. For example, the most recent movement restrictions in the UK were evidenced by the stark drop in aggregate mobility in early November, which subsequently led to the improvement in case numbers.
In addition, apart from viewing various metrics for each location, one can also compare these metrics (e.g. mobility) across different locations on-demand by toggling the “Compare Locations” option on the left. This provides two useful views of the same data – each graph can show either:
- Multiple metrics for a single location
- A single metric for multiple locations
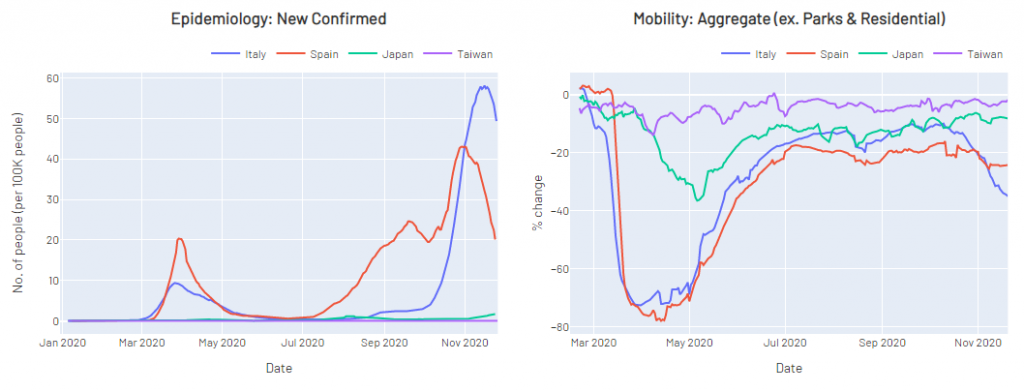
To ensure more meaningful cross-location comparisons, one can also use the “Per 100, 000 People” option to normalise the relevant metric(s) by population size. For example, we can easily visualise that more effective containment of COVID-19 in Asian regions have led to much fewer infections and less disruptions to population movement.
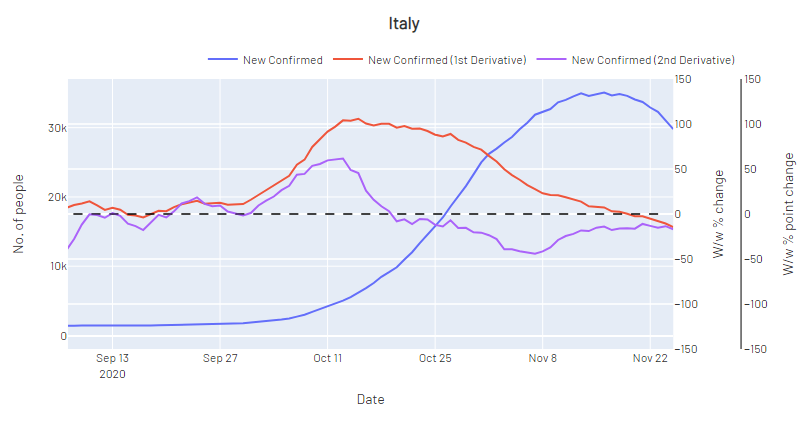
Another useful function is the calculation of case derivatives, which assists in identifying wave peaks and slowdowns in case growth rates. Identifying when a wave is getting less worse may serve as a useful leading indicator of eventual recovery in the health of the population and possibly the economy too. This can be identified through a turn in the first derivative or when the second derivative falls below zero (e.g. mid October in Italy).
We hope that the app serves as a useful tool not just for investors who have to make sense of pandemic economics, but the general public as well.
The app has been designed for cross-device readability, and can be viewed on mobile phones, tablets, and laptops/desktops.
This document is issued by Algebris (UK) Limited. The information contained herein may not be reproduced, distributed or published by any recipient for any purpose without the prior written consent of Algebris (UK) Limited.
Algebris (UK) Limited is authorised and Regulated in the UK by the Financial Conduct Authority. The information and opinions contained in this document are for background purposes only, do not purport to be full or complete and do not constitute investment advice. Under no circumstances should any part of this document be construed as an offering or solicitation of any offer of any fund managed by Algebris (UK) Limited. Any investment in the products referred to in this document should only be made on the basis of the relevant prospectus. This information does not constitute Investment Research, nor a Research Recommendation. Algebris (UK) Limited is not hereby arranging or agreeing to arrange any transaction in any investment whatsoever or otherwise undertaking any activity requiring authorisation under the Financial Services and Markets Act 2000.
No reliance may be placed for any purpose on the information and opinions contained in this document or their accuracy or completeness. No representation, warranty or undertaking, express or implied, is given as to the accuracy or completeness of the information or opinions contained in this document by any of Algebris (UK) Limited , its members, employees or affiliates and no liability is accepted by such persons for the accuracy or completeness of any such information or opinions.
The distribution of this document may be restricted in certain jurisdictions. The above information is for general guidance only, and it is the responsibility of any person or persons in possession of this document to inform themselves of, and to observe, all applicable laws and regulations of any relevant jurisdiction. This document is for private circulation to professional investors only.
© 2020 Algebris (UK) Limited. All Rights Reserved. 4th Floor, 1 St James’s Market, SW1Y 4AH.
