


About 15 years ago, the Disney movie Wall-E was released in cinemas. It is a children’s story of the last robot on Earth, left to clean and cube the endless mountains of trash left behind by humans. Wall-E’s wakeup call is still fresh, warning of humanity’s unsustainable treatment of Earth and the devastating consequences of climate change. The key message is obvious: humans should be less consumerist and instead protect the planet while we still can. On a positive note, Wall-E managed to stay charged using renewable solar energy.
Unless one grows up near a landfill, the average person doesn’t think twice about their trash once it is collected. However, all trash still must go somewhere, and most of it isn’t designed to break down for hundreds of years. On the individual level, we can reduce our impact by being aware of how much (and what type) of trash we produce, and care for where it will ultimately end up once we discard it. As investors, we believe this sector represents a significant long-term opportunity. The waste management industry has been progressively shifting from providing traditional waste services – including collection, treatment, and disposal – towards enabling a ‘circular economy’. Aside from reducing their impact on the environment, we believe this will diversify waste management companies’ revenue stream and be accretive to their returns on capital employed (ROCE).
In the following paragraphs we will explain why waste companies are a safer harbor due to 1/ high percentage of recurring revenue across major business lines and 2/ more resilient revenues through recessions while unlocking value via M&A/buybacks/dividend thanks to their strong FCF generation.

Wasted numbers
In developed economies, the solid waste industry is by now mature – with growth linked to economic factors such as GDP growth, population growth, residential and commercial construction activity, new household and business formation, and industrial production. Growth beyond these factors can occur through industry consolidation bringing about economies of scale in administrative and regulatory areas. Despite the scale of some players, the solid waste business is local, with regional regulations and individualized contracts. Competition in this industry is often price based, though this is only one of the many factors in provider selection. Large operators use scale to their advantage for cost management, efficiency, or technological improvements, boasting higher profit margins due to scale, scope, and integration.
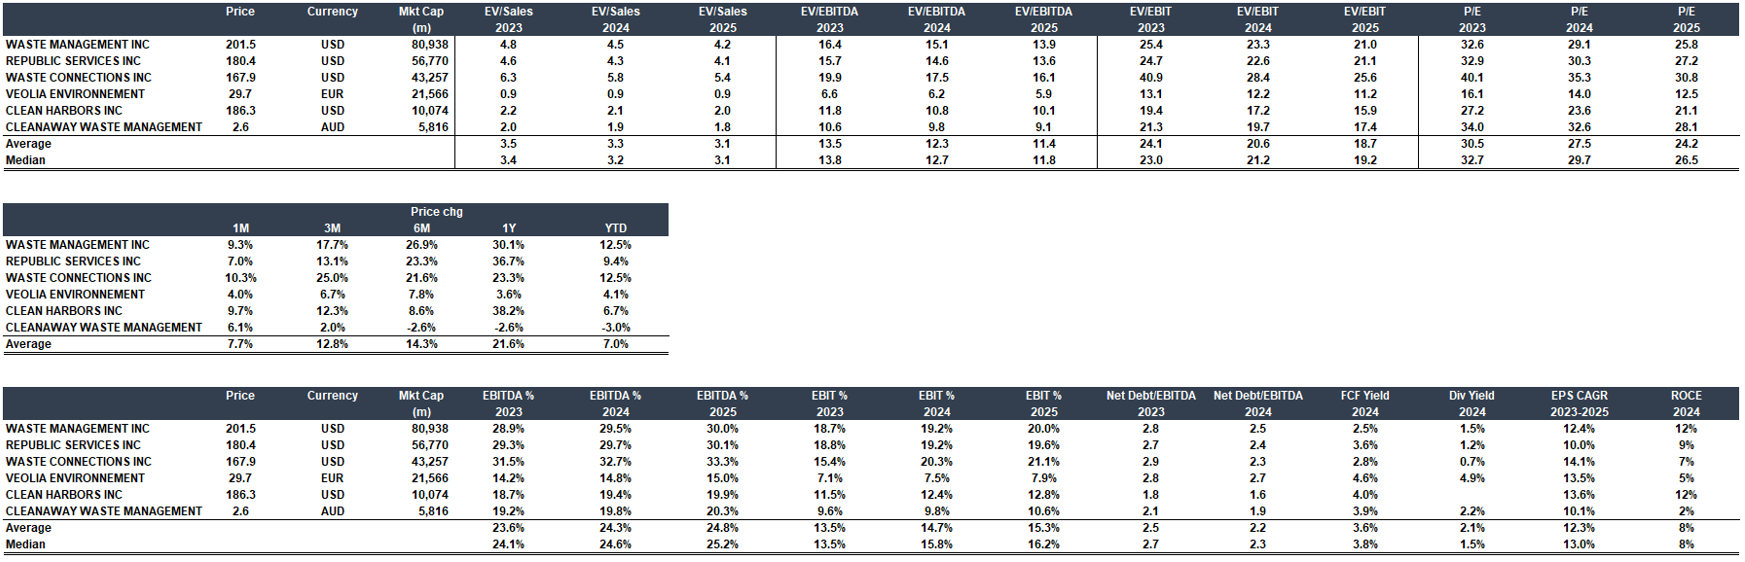
In the US, the solid waste industry has gone through a period of significant consolidation over the last two decades. It is worth 55-60bn USD and the first three players (Waste Management Inc – WM, Republic Services Inc – RSG, Waste Connections Inc – WCN) have ca. 50% market share, leaving the industry with significant consolidation opportunities. Moreover, there are extensive restrictions on the development of new landfills and expansion of current ones in the US (the number of active landfills in the United States has declined from over 8,000 to ~1,900). For companies such as WM, RSG and WCN, who own the landfills, this presents a market with a high barrier to entry whilst also providing them with an alternative revenue stream – third parties need to pay them a ‘tipping fee’ in order to use their landfills.
In low-income countries, on the other hand, this industry is still in its infancy. According to the EU, by 2030, the middle class is expected to grow by 150% in the BRIC countries, and by 116% in the N-11 countries. It is widely expected that higher per capita wealth in these regions will inflate consumerist activity, ultimately leading to more waste. By 2050, the OECD estimates that total global waste will grow to 3.4 billion tonnes from the 2.0 billion tonnes we generate today.
As the volume of waste produced is positively correlated with the projected income growth of a region (see figure 1), we expect waste output growth to be higher in lower income levels. Over the next 30 years, high-income countries are expected to see a 19% increase in waste output, whereas low- and middle-income countries are expected to see a 40%+ increase (World Bank, 2018).

Source: World Bank, IMF, Algebris Investment (Data as at 20/09/2018)
Not all Waste is Equal

Source: World Bank, IMF, Algebris Investments (Data as at 2023)
Generally, dry waste (such as plastic, cardboard, metals, and glass) accounts for 56% of the overall waste generated on average at the global level, and food and green waste for the remaining 44% (figure 2).
The composition of waste produced often varies depending on the income level. OECD and World Bank data suggest that high income countries lean towards producing predominantly dry waste (51% of waste produced) rather than food or green waste (roughly 32%).
This pattern is inverted in middle- and low-income countries, which generate 53% and 56% respectively of more difficulty recyclable green and food waste. These two types of waste differ in terms of recyclability. Nearly all dry waste is recyclable, whereas organic waste decomposes over time and is known to have a stronger environmental impact due to the gases which it releases during decomposition.

Source: World Bank, Algebris Investments (Data as at 20/09/2018)
With more stringent oversight and higher income levels, developed countries have waste collection mechanisms in place to ensure waste is not only removed from the environment, but also adequately processed to be tentatively reused. According to the World Bank, almost as much waste is recycled as incinerated (29% and 22% respectively), while most of the remaining waste – 39% – gets stored in landfills (figure 4).
Landfills also have an impact on the environment, as they produce landfill gas that is typically composed of 50% carbon dioxide and 50% methane. As seen in figure 3, of the total waste that ends up in landfills, only 8% is in sanitary landfills implementing landfill gas (hereinafter LFG) recovery mechanisms, and 4% in controlled ones. In parallel to recycling, which is already a growing market, waste management companies in advanced economies are implementing alternative methods to profitably leverage waste.
In developing countries, the situation is very different. Given the low rates of recycling and oversight in waste management, only 7% to 34% of waste is handled with care and not open dumped (figure 4). Open dumping has the highest adverse impact on the environment both from gaseous diffusion and leakage perspective. The projected increase in waste in low-income countries, coupled with their low recycling rates and lack of infrastructure, poses a challenge for effective waste management on a global scale. As the implementation of the pathways discussed below generate revenue for current waste management companies, we believe that the economics of waste will eventually spread to other regions of the world, as they seek to tackle this broader challenge.

Source: World Bank, OECD, Algebris Investments (Data as at 01/01/2023)
Turning Trash into Cash
Opportunities to increase returns lie across the waste management sector, specifically in the theme of reusing discarded materials or byproducts. We present 3 pathways currently in play by waste management companies that we believe will be accretive to company margins and returns on invested capital (ROCE). These are LFG capture, fleet optimization, and advanced recycling.
1. Leveraging LFG

Source: US Environmental Protection Agency
LFG is an important component for waste management companies as it has both significant environmental implications as well as revenue generation potential. For landfill operators, LFG represents 85-95% of their total GHG emissions.
Companies like WM and RSG are investing in LFG capture and purification infrastructure in order to commoditize the gas and sell it at a premium on the renewables market. This is done by converting the LFG into renewable energy sources like Renewable Natural Gas (RNG) or electricity. A $30 million LFG project can return $10-$15 million in EBIT annually, considering operating costs of around $8 per MMBtu (WM, 2023). WM suggests that these facilities could operate with 65-70%+ profitability, meaning RNG facilities having a relatively short payback period of 2-3 years. LFG therefore presents an opportunity to improve waste management companies’ corporate margins whilst diversifying their revenue streams.
However, challenges in leveraging LFG include the economic viability of LFG capture in landfills which do not produce enough biogas, and the high upfront capital costs of investing in RNG and LFGTE facilities. Despite these drawbacks, WM is well positioned to take advantage of LFG. Having invested roughly $1billion in sustainability capex in 2023, they operate 144 LFG to renewable energy projects, including 102 LFGTE facilities and 16 RNG facilities (and another 26 miscellaneous projects), with more on the way.
2. Fleet & Route Optimization
For waste management companies, emissions from their waste collection fleets represent their second largest share of GHG emissions (5-15%). While opportunities to generate revenue are less evident in fleet optimization, incentives are twofold. Lower environmental impact will improve companies’ reputation thereby facilitating their access to capital, and more efficient fleets will lower operating costs are therefore improve margins. WM, RSG, and others, have taken two approaches to abate their fleet impact: (i) optimizing waste collection routes for efficiency; and (ii) converting the older vehicles to ones using either electricity or cleaner fuels.

Source: Algebris Investments (Data as at 17.01.2024)
Optimizing routes cuts while increasing collection volumes. Shorter routes equally lower the wear-and-tear on the collection vehicles, and thereby maintenance costs, as well as the fuel usage. This is especially important given the volatility of fuel prices (figure 6).
Additionally, replacing old fossil fuel vehicles with more fuel-efficient, alternative fuel, or battery-operated vehicles is a key cost-cutting strategy. WM, for instance, aims for 70% of its fleet to be fueled by renewable natural gas (RNG) by 2025, having already achieved over 50%. RSG is also replacing diesel vehicles with compressed natural gas (CNG) or RNG vehicles, constituting 21% of their fleet as of 2020. Streamlining their collection processes and infrastructure, waste management companies’ margins will see improvements in the collection segments of their business, allowing more cash to be returned to shareholders.
3. Advanced recycling

Source: Algebris Investments (Data as at 17.01.2024)
The last revenue opportunity for waste management companies is recycling. With over 30 North American Consumer Packaged Goods (CPG) companies setting plastic recycling targets for 2025 and 2030, the total North American addressable market of PET is expected to grow to $3.3-$4.1 billion by 2030 based on Morgan Stanley estimates.
Opportunities for companies lie across the value chain, from collection (mentioned in section B), to processing, and remanufacturing. Front end revenues can come through the collection fees, while significant revenue potential can come from processing and remanufacturing of recycled materials. Processing and remanufacturing require infrastructure investments from companies to build main recycling facilities (MRFs): both WM and RSG have 138 and 71 active recycling facilities each. Goldman Sachs envisions processing costs at $50-$60 per ton at very automated MRFs, and of $80-$100 at more analogue ones. Albeit recycling currently represents a relatively small fraction of their revenues, 8% of WM and 4% of RSG in 2022, the global recycling market is expected to grow with a CAGR of 8.7% to 2031 (figure 7), allowing for significant room for expansion.
Playing defense with trash
Waste companies enjoy a high percentage (~80%) of recurring revenue across major business lines thus giving them a strong defensive profile. Most collection contracts span multiple years with built-in price escalators. Often waste companies manage exclusive/franchise contracts for customers, reducing churn and supporting margins. Landfills serve as a competitive advantage versus smaller local competitors and provide decades of predictable volumes (of the ~1,900 active landfills in the United States, the top three solid waste companies own ~50%).
Solid waste volumes generally lag the broader economy by 4-6 quarters, both in and out of recessions. Sector revenue generally declines more moderately through recessions as many of the services are essential to customers. Residential volumes show limited variability during downturns, while commercial and industrial collections are generally more cyclical.
Finally, waste companies have consistently generated strong FCF (10-13% of revenue) over the last decade even through the Great Recession, with a current average free cash flow yield of ~5%. This is a necessary investment characteristic for a mature industry that offers high visibility with respect to investment needs and contract terms. Approximately 70% of FCF is deployed toward a combination of stock repurchases and dividends, while smaller acquisitions are often cash funded.
Cover image was created with the assistance of DALL·E 2
This document is issued by Algebris Investments. It is for private circulation only. The information contained in this document is strictly confidential and is only for the use of the person to whom it is sent. The information contained herein may not be reproduced, distributed or published by any recipient for any purpose without the prior written consent of Algebris Investments.
The information and opinions contained in this document are for background purposes only, do not purport to be full or complete and do not constitute investment advice. Algebris Investments is not hereby arranging or agreeing to arrange any transaction in any investment whatsoever or otherwise undertaking any activity requiring authorisation under the Financial Services and Markets Act 2000. This document does not constitute or form part of any offer to issue or sell, or any solicitation of an offer to subscribe or purchase, any investment nor shall it or the fact of its distribution form the basis of, or be relied on in connection with, any contract therefore.
No reliance may be placed for any purpose on the information and opinions contained in this document or their accuracy or completeness. No representation, warranty or undertaking, express or implied, is given as to the accuracy or completeness of the information or opinions contained in this document by any of Algebris Investments, its members, employees or affiliates and no liability is accepted by such persons for the accuracy or completeness of any such information or opinions.
This document is being communicated by Algebris Investments only to persons to whom it may lawfully be issued under The Financial Services and Markets Act 2000 (Financial Promotion) Order 2005 including persons who are authorised under the Financial Services and Markets Act 2000 of the United Kingdom (the “Act”), certain persons having professional experience in matters relating to investments, high net worth companies, high net worth unincorporated associations and partnerships, trustees of high value trusts and persons who qualify as certified sophisticated investors. This document is exempt from the prohibition in Section 21 of the Act on the communication by persons not authorised under the Act of invitations or inducements to engage in investment activity on the ground that it is being issued only to such types of person. This is a marketing document.
The distribution of this document may be restricted in certain jurisdictions. The above information is for general guidance only, and it is the responsibility of any person or persons in possession of this document to inform themselves of, and to observe, all applicable laws and regulations of any relevant jurisdiction. This document is suitable for professional investors only. Algebris Group comprises Algebris (UK) Limited, Algebris Investments (Ireland) Limited, Algebris Investments (US) Inc. Algebris Investments (Asia) Limited, Algebris Investments K.K. and other non-regulated companies such as special purposes vehicles, general partner entities and holding companies.
© 2024 Algebris Investments. Algebris Investments is the trading name for the Algebris Group
