The dollar is our currency, but it’s your problem.
John Connally, US Treasury Secretary, 1971

Until the end of 2021, macroeconomic volatility seemed a thing of the past. Secular stagnation would keep inflation low forever, paving the way for indefinite financial repression. Fiscal discipline was abandoned en masse, as central banks would buy bonds at any price. Unfunded fiscal expansions became the norm, leading to large deficits that didn’t revert.
The developed world accumulated imbalances, and markets did not react. Currency and interest rates instability was a concern of just a few underdeveloped countries.
2022 came as a sudden wake-up call. Global inflation jumped from 2% last year to 10% today, burning years of easy money in the bat of an eyelid. Developed markets had to re-learn how to cope with market discipline. Central banks had to re-learn how to be inflation watchdogs. Loose policies are now punished with higher rates and currency crashes. Bond vigilantes are back, and policy-makers need to get used to it once again.
The United Kingdom learned the lesson the hard way last week. An unfunded fiscal expansion worth 5% of GDP triggered panic on the pound and a run on domestic pension funds. In 2020, a fiscal loosening three times as large had left gilts unscathed, with the 10y yield unchanged and well below 1%. Italy is still protected by ECB programs, but limits to anti-fragmentation may emerge in the European periphery soon too.
Dollar strength means loose monetary policy is untenable too. In Japan, the Finance Ministry was forced to engage in currency intervention. China is likely to follow suit. In India, the central bank is running down reserves to defend the Rupee. A Plaza-style global currency agreement is harder than thirty years ago, as the US would need to negotiate with Europe and China at the same time.
In the 70s, the global energy crisis had long-lasting consequences as the root problem was not solved. As a result, countries had to choose between massive hikes (US) or deep devaluations (UK).
The current crisis has a similar feature. The war in Ukraine remains far from resolved, and energy markets will remain under pressure at least until next summer. Fiscal policy will thus be needed to limit the energy fallback. In Europe, 2022 budget deficits will be north of 4%, despite higher borrowing costs.
As governments have no alternative other than to spend and propel their economies through the winter, countries where fiscal policy is less credible or where the central bank is behind the curve will get punished. Country risk is back: investors will need to be selective and reactive, picking countries with good policy mix and able to reactively adjust positioning when policies change.
At current levels, we see a great opportunity in credit and are starting to position for a turn in US rates. Credit spreads reflect too much pessimism. Our analysis suggests the European gas picture is tight but manageable at current demand destruction rates. As a result, credit stress will be less than priced in. Historically, entering credit markets at current spread levels has led to double-digit returns.
Markets now price 5% and 3% terminal rates for the Fed and ECB respectively. We doubt central banks will go beyond that. In the US, mortgage rates are affecting the housing market and the economy is slowing. Leading indicators point to a moderation in inflation. Lower inflation will in turn remove pressure from FX and the ECB.
The West thought macro was dead, and 2022 shows us it is alive and well. As inflation explodes quickly but dies slowly, the new old paradigm is here to stay. Bouts of volatility offer opportunities, which abound in the current environment.
MACRO VOLATILITY | Welcome to the old normal
2022 marked the return of macroeconomic volatility, after ten years of calm induced by quantitative easing (QE). The global energy crisis has hit economies right after the most spectacular monetary expansion of the past thirty years. The result has been a massive burst of global inflation. World inflation is now running at 10%, the highest in 20 years. Core inflation is a multiple of central bank targets in every country, except China and Japan (Table 1).
The problem with current inflation is that it is not mean-reverting. Once the genie of price increases is out of the bottle, it’s hard to put it back in, as price-setting behavior changes permanently. Historical experience in developed markets show that once inflation crosses 5%, it takes about ten years to go back below 2% (Chart 1). In emerging markets, which couldn’t afford QE, monetary expansions led to persistent inflation and currency devaluation even in recent years. In fact, Turkey, Brazil and South Africa all lived with inflation above target for most of the past ten years. Developed markets are back to the old world of macro, as the QE parentheses close for good.

Source: Bloomberg Finance L.P., Haver, US BLS. Data as of 22 September 2022 | Note: For core YoY, the shading is based on a comparison of core YoY over the entire time period for each given country. Max red means highest core YoY, and max green means lowest core YoY, with yellow being the middle. Time period starts in 2000 for every country apart from: 2001 for South Korea, Poland Brazil and Mexico, 2003 for South Africa, 2004 for Russia and Turkey, 2006 for China, 2009 for Indonesia and 2012 for India.
Entrenched inflation led to high inflation expectations and volatile interest rates (Chart 2). Once economies re-price persistent price increases, pressure on long-term rates increases and oscillations proportionally rise. Investors and savers will thus need to look seriously at the problem of managing inflation and dealing with interest rates, just as it was the case until the mid-2000s.
Policy | Back to market discipline
As inflation comes back, limits to policy re-emerge. In the QE world, large deficits did not put pressure on interest rates, and currencies did not bear the cost of stimulus. As a result, market discipline was a concept only known to emerging markets. As bond vigilantes are back, markets will be more careful in selecting countries where policymakers are wary. The UK stands as a case in point, as the new cabinet announced a fiscal expansion worth 5% of GDP, without detail on funding and despite a slow-moving Bank of England. The result was 150bp widening in gilts and a 10% slump in the currency in just ten days , which forced BOE to a market operation just three days after the event. In 2020, a fiscal expansion of three times the size left gilts below 1% and didn’t put any pressure on sterling. In Europe, the ECB was forced into hikes by the downward pressure on the currency. In Japan, the BOJ was forced to intervene for the first time in twenty years. China and India may follow suit. In Italy, spreads fail to widen just because the ECB remains supportive.
Inflation | The smoke points south
In the new regime of macro volatility, ups and downs are quicker and deeper. The good news is that interest rates and the dollar may be close to a turning point for the time being, as the well-anticipated drop in US inflation is not far off. Since summer, US data display a clear easing of supply bottlenecks (Chart 4), and high frequency data show rent inflation has peaked. Global commodities (ex-natural gas) are lower on a 3-months basis, and oil is 30% below its peak in June. Headline inflation is 1% lower than its peak in July, and the next two prints will continue to point south. Headline and core inflation will drop, respectively, to 7% and 5.5% by the end of the year (Chart 5). In Europe, the peak is not as close, as gas prices rallied aggressively in August (though they are currently 50% lower than the peak).
Central banks | The end is in sight
In the current environment, central banks have no choice but to keep a hawkish tone. Inflation has been high for so long that credibility is at stake. Moreover, US growth is slowing much less than other major economies, setting a hawkish global benchmark. Markets, however, have gotten there already. Fed pricing is just shy of 5% terminal rate, and ECB pricing is above 3% (Chart 6). In the US, mortgage rates are already above 6% (Chart 7), a level that is triggering a sharp fall in housing permits. UK mortgage rates may soon hit 7%. Current levels of short-term rates are thus hawkish compared to central banks projections and approaching disruptive levels. The terminal rate looks particularly high for the Fed, as the strong USD re-pricing has done part of the job in tightening financial conditions (Chart 8). Central banks across the rest of the world will need to hike more to keep up the pace with the USD – such as Europe and Latin America, or accept sharp devaluations – such as the UK and Asia.
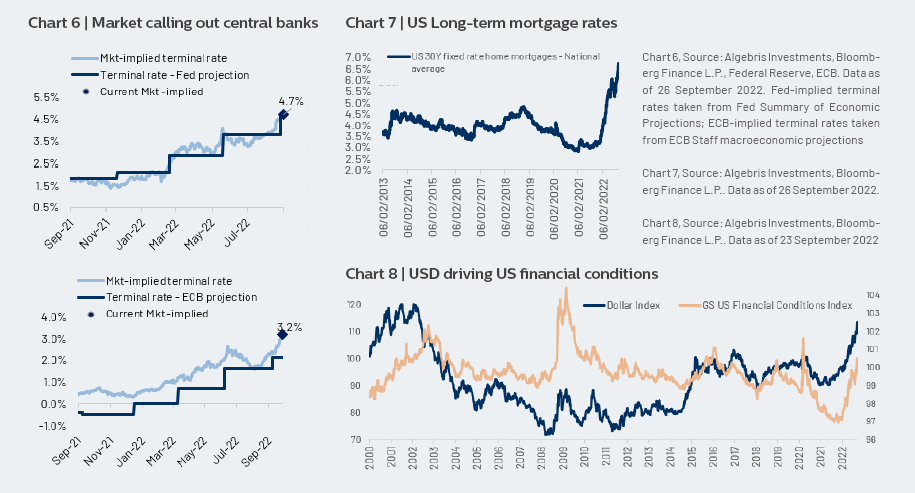
Chart 6, Source: Algebris Investments, Bloomberg Finance L.P., Federal Reserve, ECB. Data as of 26 September 2022. Fed-implied terminal rates taken from Fed Summary of Economic Projections; ECB-implied terminal rates taken from ECB Staff macroeconomic projections
Chart 7 | US Long-term mortgage rates
Chart 7, Source: Algebris Investments, Bloomberg Finance L.P.. Data as of 26 September 2022.
Chart 8 | USD driving US financial conditions
Chart 8, Source: Algebris Investments, Bloomberg Finance L.P.. Data as of 23 September 2022
ECONOMY | The R word
The global economy has entered a slowdown. Europe will enter a technical recession due to the energy crisis, the US is slowing down, and China is still paralyzed by local policy. However, we think the recession won’t be as deep as some projections and market pricing suggest. The equation of physical gas supply suggests that most of the necessary demand destruction is well underway in Europe, and the US consumer remains remarkably solid. China activity remains depressed, but stimulus is slowly kicking in and zero-covid may gradually phase out after the Communist Party Congress in mid-October.
Europe | Gasless Economics
After a very hot summer, winter is coming. Gazprom has announced a significant curtailment of flows of gas to Europe, and no Russian gas in winter is now the central scenario. Energy savings are going to play a central role in the sustainability equation for the EU. Our analysis suggests that if the amount of demand destruction seen so far is sustained throughout the winter, storage levels won’t turn negative (Table 2). The result is important as it suggests the economic disruption needed to get to the spring is way smaller than many studies suggest.
Both highly exposed to the Russian gas shock, Italy and Germany differ in their capacity to diversify gas procurement and in the approach they have taken to energy savings. Having little option to diversify away from Russia in the short term, Germany has been saving energy at a significantly high rate so far in 2022 (consumption has dropped by ~15% monthly) and as a result the outlook for German gas reserves is less bleak than many had expected until a few months ago. Italy instead has been reducing consumption less (2% on average), also thanks to more alternative sources. In Germany, a 15% slump in gas consumption since January has been so far associated with only a 2% reduction in industrial production (Chart 9). Current demand destruction is thus also consistent with a somewhat limited economic cost.
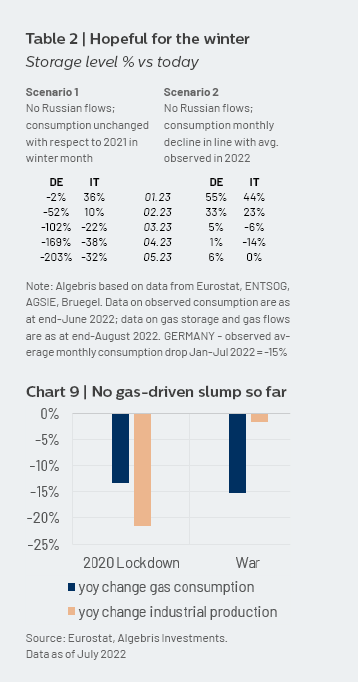
Chart 9, Source: Eurostat, Algebris Investments.
Data as of July 2022
US | Slowing is not slumping
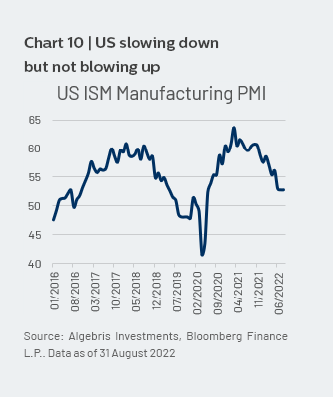
In US, the economy is slowing but remains solid. Leading indicators are slowing but not slumping (chart 10), and ISM PMI remais in expansion. Labor markets are solid, with unemployment below 4% and record job creation in August. Interest rates are hurting mortgage applications and the housing market, but the wealth accumulated during covid has strongly improved the financial position of the US consumer. 93% of mortgages are fixed for 30 years with an average rate of 3.5%, leaving families well insulated from higher interest rates. Household debt service is at lows, and the net wealth of families remains well above trend. Real consumption is trailing an annual reduction of 2% despite a 6% reduction in real income, suggesting wealth accumulation is playing an important role. Inflation relief, likely in the coming months, will further help consumers.
MARKETS | Long credit, but keep it flexible
Markets remain under pressure as central banks are hawkish despite a slowing economy and some signs of cooling in inflation. The latest leg of the move in US Treasuries brought real rates to 5y highs and just 100bp below pre-2008 highs (Chart 11). Inflation breakevens are actually falling, and are 70bp below March levels. We see opportunities in credit markets but recommend a very flexible approach to duration and FX.
Credit | Value in spreads
Credit is the area where we see most value. Spreads are at levels seen only in deep recessions and systemic events. European CDS have been at current levels (650bp) only in 2008 and 2012. Outflows remain significant in credit markets, with ETFs showing record redemptions in September, and active funds data showing the majority of inflows in 2020-21 have been reverted. Distressed ratios are north of 10% across indexes, with record a gap between spreads and actual default rates (Chart 12). While this could mean stress will come later, the gap between implied and actual stress rates is implausibly high. Using reasonable recovery rates, the index prices 10-12% default rates per year, compared to a 10y high of 4%, reached in 2012. Overall, most of the capitulation boxes have been ticked in credit. In the past twenty years, entering credit around these spread levels led to 8-12% returns over the subsequent year.
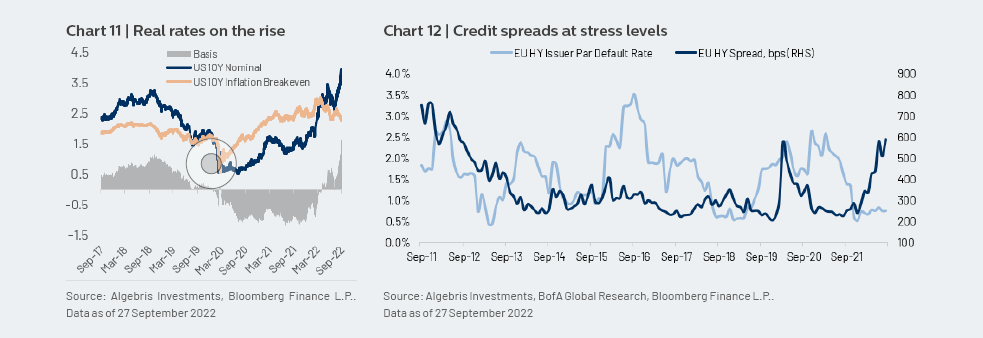
Chart 12, source: Algebris Investments, BofA Global Research, Bloomberg Finance L.P.. Data as of 27 September 2022
Europe and EM | The beaten-downs
Europe and emerging markets are the two areas where most of the pessimism is reflected. In Europe, hedges are at record highs across asset classes. Emerging markets have seen the worst outflows in 2022, and 50% of the hard currency index trades at distressed levels. Long-term investors should focus their attention selectively on those areas. In Europe, subordinated bank debt offers 11-12% yields, despite the short duration implicit in the call structure and the enhanced profitability from higher rates. The recent deviation of bank equities from bunds point to a clear opportunity (Chart 13). At sector level, we see opportunities in telecoms, healthcare and automotive sectors. In emerging markets, BB $ credits with small external debt pay close to 9% $ yields (for e.g. South Africa, Colombia or Brazil). Local markets are also starting to look attractive in EM, as some countries have been ahead of the Fed and now have high real rates despite a slowing economy (eg Mexico and Brazil, chart 14).
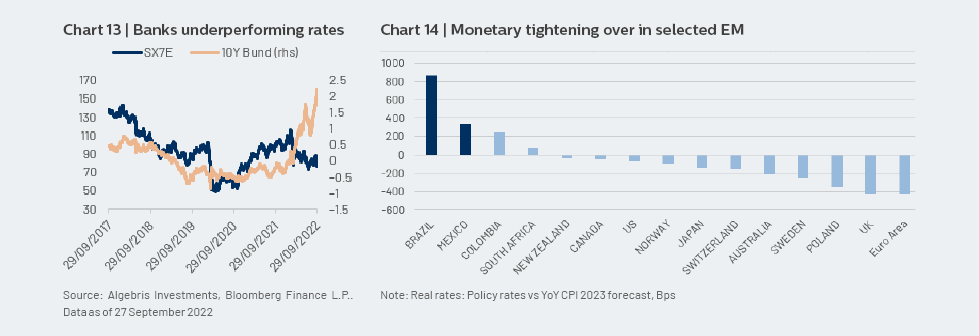
Chart 14, note: Real rates: Policy rates vs YoY CPI 2023 forecast, Bps
Macro | Mind rates & USD
While we see a clear opportunity in credit, the macro backdrop will remain volatile. As such, a tactical approach to rates and FX remains key. At current levels, US rates have more value than European rates. The gap in policy rates between the two is at highs and the US displays clear signs of inflation deceleration and a cooling economy. US duration may thus be close to a turn. In Europe, pressure on the currency is higher, and the gas situation keeps delaying the inflation peak. The ECB will thus need to close the gap fast. We still see little value in European rates, including periphery. In FX, central banks that avoid following the US will continue to see pressure on the currency (GBP, JPY, CNH).
CONCLUSION | Back to old lenses
We see the energy crisis as the bridge between the old world of monetary expansion and the new world of high and persistent inflation in developed markets. The new world is not that new, though, as it brings us back to a the old normal that prevailed in all countries before 2008. As such, investors will need to look at macro policy and fixed income markets with new (old) lenses. Inflation will remain high and volatile, bringing central banks back to a watchdog role. Fiscal discipline is back, so budget cuts will need to pass the market check. Governments falling behind the curve will be punished through weak currency. In other words, macro is back, and this is exactly the environment in which active funds managed in a rigorous risk framework should florish.
Davide Serra
Founder & CEO
Sebastiano Pirro
CIO & Financial Credit Portfolio Manager
Gabriele Foà
Global Credit Portfolio Manager
Silvia Merler
Head of ESG & Policy Research
For more information about Algebris and its products, or to be added to our distribution lists, please contact Investor Relations at algebrisIR@algebris.com. Visit Algebris Insights for past commentaries.
This document is issued by Algebris Investments. It is for private circulation only. The information contained in this document is strictly confidential and is only for the use of the person to whom it is sent. The information contained herein may not be reproduced, distributed or published by any recipient for any purpose without the prior written consent of Algebris Investments.
The information and opinions contained in this document are for background purposes only, do not purport to be full or complete and do not constitute investment advice. Algebris Investments is not hereby arranging or agreeing to arrange any transaction in any investment whatsoever or otherwise undertaking any activity requiring authorisation under the Financial Services and Markets Act 2000. This document does not constitute or form part of any offer to issue or sell, or any solicitation of an offer to subscribe or purchase, any investment nor shall it or the fact of its distribution form the basis of, or be relied on in connection with, any contract therefore.
No reliance may be placed for any purpose on the information and opinions contained in this document or their accuracy or completeness. No representation, warranty or undertaking, express or implied, is given as to the accuracy or completeness of the information or opinions contained in this document by any of Algebris Investments, its members, employees or affiliates and no liability is accepted by such persons for the accuracy or completeness of any such information or opinions.
This document is being communicated by Algebris Investments only to persons to whom it may lawfully be issued under The Financial Services and Markets Act 2000 (Financial Promotion) Order 2005 including persons who are authorised under the Financial Services and Markets Act 2000 of the United Kingdom (the “Act”), certain persons having professional experience in matters relating to investments, high net worth companies, high net worth unincorporated associations and partnerships, trustees of high value trusts and persons who qualify as certified sophisticated investors. This document is exempt from the prohibition in Section 21 of the Act on the communication by persons not authorised under the Act of invitations or inducements to engage in investment activity on the ground that it is being issued only to such types of person. This is a marketing document.
The distribution of this document may be restricted in certain jurisdictions. The above information is for general guidance only, and it is the responsibility of any person or persons in possession of this document to inform themselves of, and to observe, all applicable laws and regulations of any relevant jurisdiction. This document is suitable for professional investors only. Algebris Group comprises Algebris (UK) Limited, Algebris Investments (Ireland) Limited, Algebris Investments (US) Inc. Algebris Investments (Asia) Limited, Algebris Investments K.K. and other non-regulated companies such as special purposes vehicles, general partner entities and holding companies.
© Algebris Investments. Algebris Investments is the trading name for the Algebris Group.


