
Loud Opposition
AI investment in the United States amounted to almost 1.8% of national output this year (600 billion dollars) and it is estimated to head for 2.5% in 2027 – a share that compares with the peaks of earlier general-purpose technology buildouts [1]. AI-related investment has become a dominant driver of US GDP growth, and the massive buildout of data centres has been its most tangible physical representation.
The underlying catalyst for this infrastructure buildout is ultimately land availability, power and permitting rather than by solely politics, and the pipeline is concentrated in a short list of states accordingly. Several of them, however, happen to be home to the closest races of the year (Figure 1)[2]. The nine states the Cook Political Report rates as toss-ups hold 36 percent of the sites in the pipeline and 45 percent of its announced capacity, against 25 percent of the population, and the same states hold 35 percent of the operating fleet3. Texas for example has 137 sites in the pipeline and a Senate race that was moved to toss-up in August. Georgia has 85 sites and a toss-up race for governor. Ohio, Michigan, Iowa, Arizona and Nevada each have a toss-up race for Senate or governor as well[3]. An NPR analysis of AdImpact’s ad-tracking database counts more than 45 million dollars of broadcast and cable ads mentioning data centres from January to August 2026, split almost evenly between Republican and Democratic candidates. Georgia’s governor race alone accounts for 12.8 million of data-center-related ads[4], and Spotlight PA newsroom found that in Pennsylvania data centres featured as a topic in at least 20 potentially competitive legislative races 11.
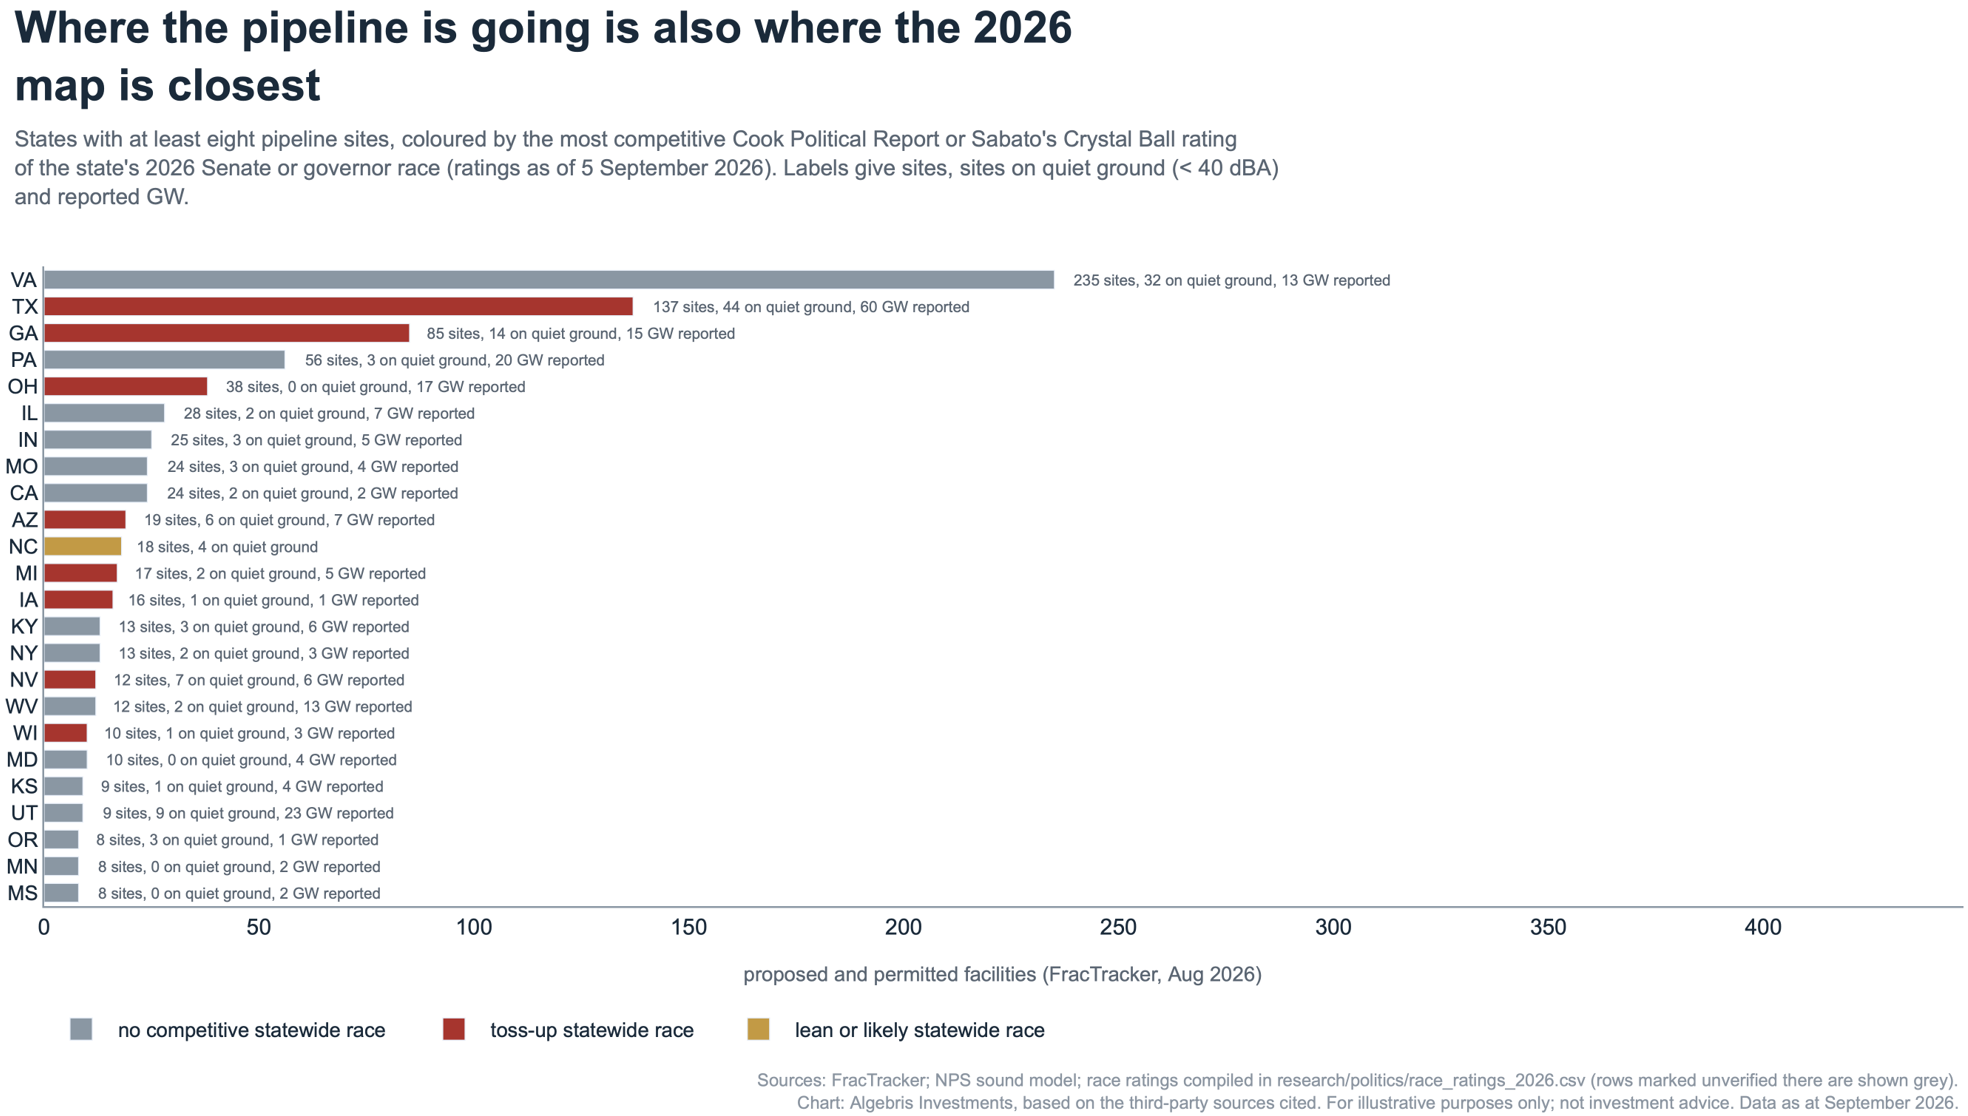
On 19 August 2026 President Trump told technology and crypto executives at the White House that if he were a mayor or a governor he “would absolutely want” a data center “because the jobs are enormous and the money paid, the taxes paid, are just enormous”5. But voters disagree. In December 2025, 42% of voters told Emerson College Polling that they would oppose a data center near their community; by July 2026, on the identical question, 63% did. A Fox News poll the same month found seven in ten voters opposed to a data center in their area, and nearly eight in ten preferring slower construction so that environmental and community concerns can be addressed. Texas, which has the largest data center pipeline of the toss-up states, is no exception: University of Texas poll in August 2026 put opposition there at 57 percent, with Republicans split almost evenly and three in four Democrats against14.
Politicians have noticed, and candidates in the closest races are distancing themselves from datacentres[5]. Voters’ concerns about data centres’ sizeable energy and water needs have led some local officials to introduce strict requirements to authorize construction permits. States like Pennsylvania, for example, require the newest campuses to be built with their own power generation capacity, so as not to drive up energy prices for the neighboring communities[6]. Texas’s Democratic nominee for governor promises to hold household electricity prices flat “until we have laws to ensure that data centres and other high-load users pay for themselves”, Iowa’s says data centres “should pay full taxes and the costs of upgrading the electrical grid”, and Ohio’s Republican nominee has posted an “Ohioans-first data center pledge”[7].
It’s Oh So Quiet
While the energy and water consumption of data centres have been at the center of political debate for quite some time, an issue that has been largely underexplored but has recently been growing more salient is that of noise.
As the New York Times put it in a recent article: “the cloud has a sound”. More technically, computing generates heat, heat demands cooling, and the heat ends up outdoors, released through chillers, cooling towers or dry coolers whose fans are essentially what nearby residents hear[8]. Among the externalities that data centres impose on local communities, noise pollution has so far drawn less attention than electricity bills or dirty water, but this may be starting to change. Bloomberg reports that acousticians are in high demand, as the need to measure and mute the hum of data center cooling becomes more widespread[9]. Some of the noise consists of infrasound (ultralow frequency waves) which is inaudible to humans but is reportedly felt in the form of insomnia and sleep deprivation, headaches, internal ear pressure and anxiety.
As datacenter buildouts are getting bigger, development is moving to areas with greater land availability[10]. Much of the shift towards quieter land reflects plans to build more data centres in rural areas. But rural does not always mean quiet. Pew estimates that two-thirds of planned data centres are in rural counties, yet only about half of those rural sites meet this report’s definition of quiet. Roads and industry can make rural areas noisy too. The sound map identifies quieter locations where noise from a new data center could be especially noticeable. Figure 2 uses the National Park Service’s 2014 sound map, the latest national map available. Some places may have become noisier since then, so the report may count sites as quiet that no longer are.5. We place on that map every data center which is either already running or in the pipeline to be built and read off how quiet the map records the ground under each one1. We call a place “quiet” when it sits below 40 decibels, which is roughly the sound of a library around midday[11]. The town of Umatilla (in Oregon) offers a good example of how things are changing: sitting on the Columbia River, Umatilla used to enjoy summer days that were quieter than in many national parks [12]; now, twenty-four data centres have Umatilla as their nearest town. Their cooling sounds like is “a hum that does not stop” [13]. In a city, much of that hum would go unnoticed amidst the noise of traffic, but on ground as quiet as Umatilla’s there is little to hide it.
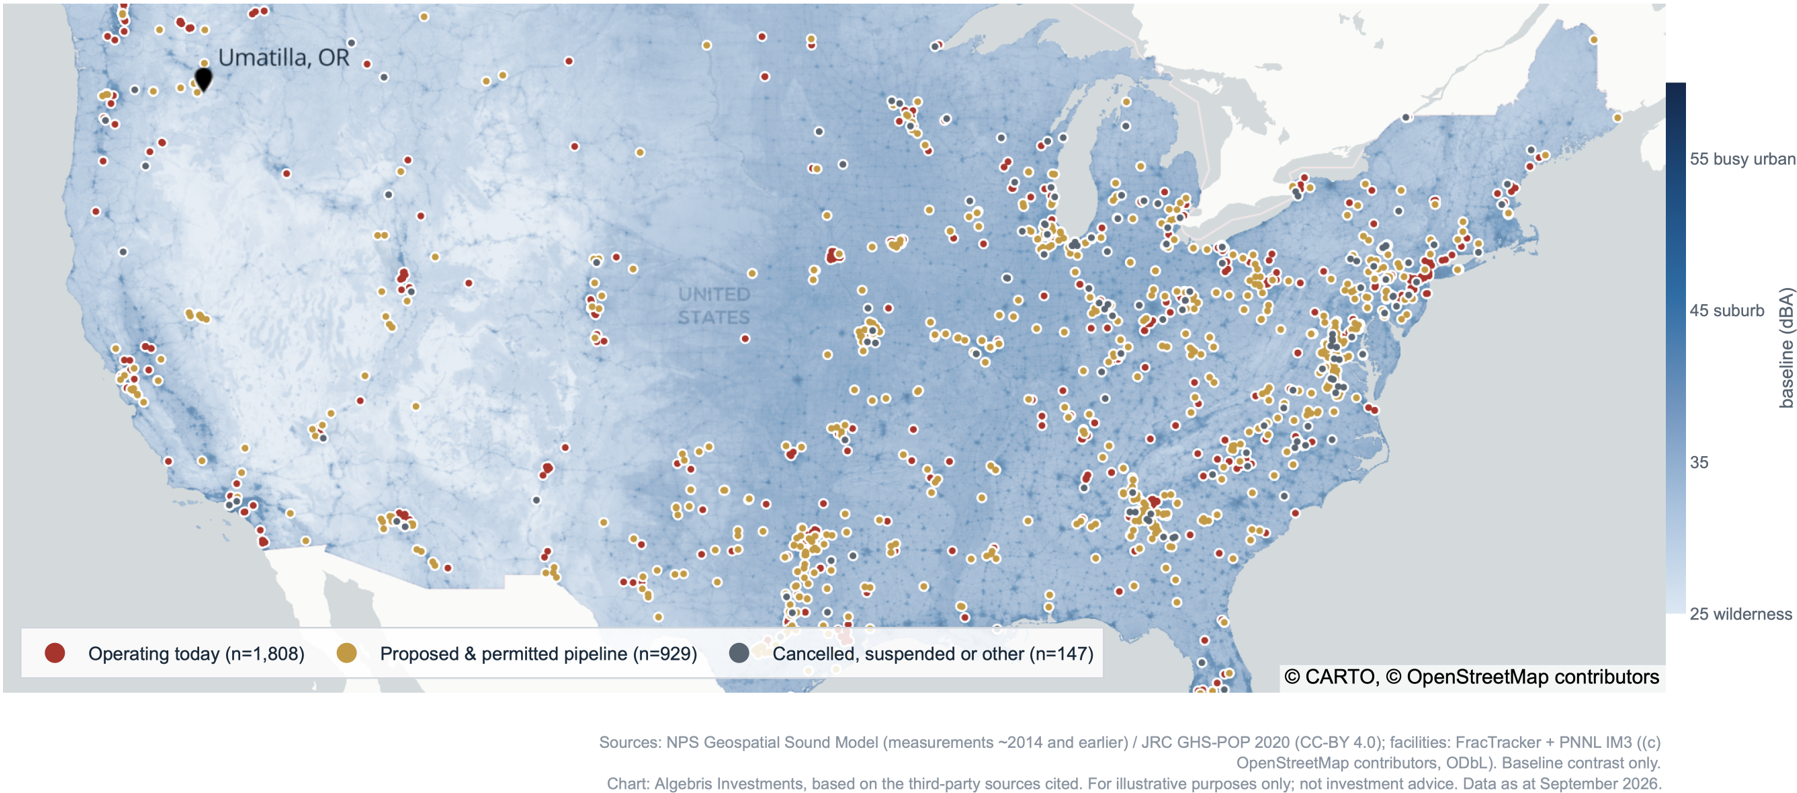
Umatilla is not unique. Most of today’s data centres were built on grounds that were not quiet to begin with1,9, but the story changes for the sites that are still in the pipeline. According to FracTracker data, the 927 proposed or permitted facilities are in noticeably quieter areas than the 601 already in operation. One in five of the coming facilities is planned for ground we established to be quiet, against one in thirty of the fleet running today9, and the largest campuses are sited on quiet ground far more often than smaller projects.
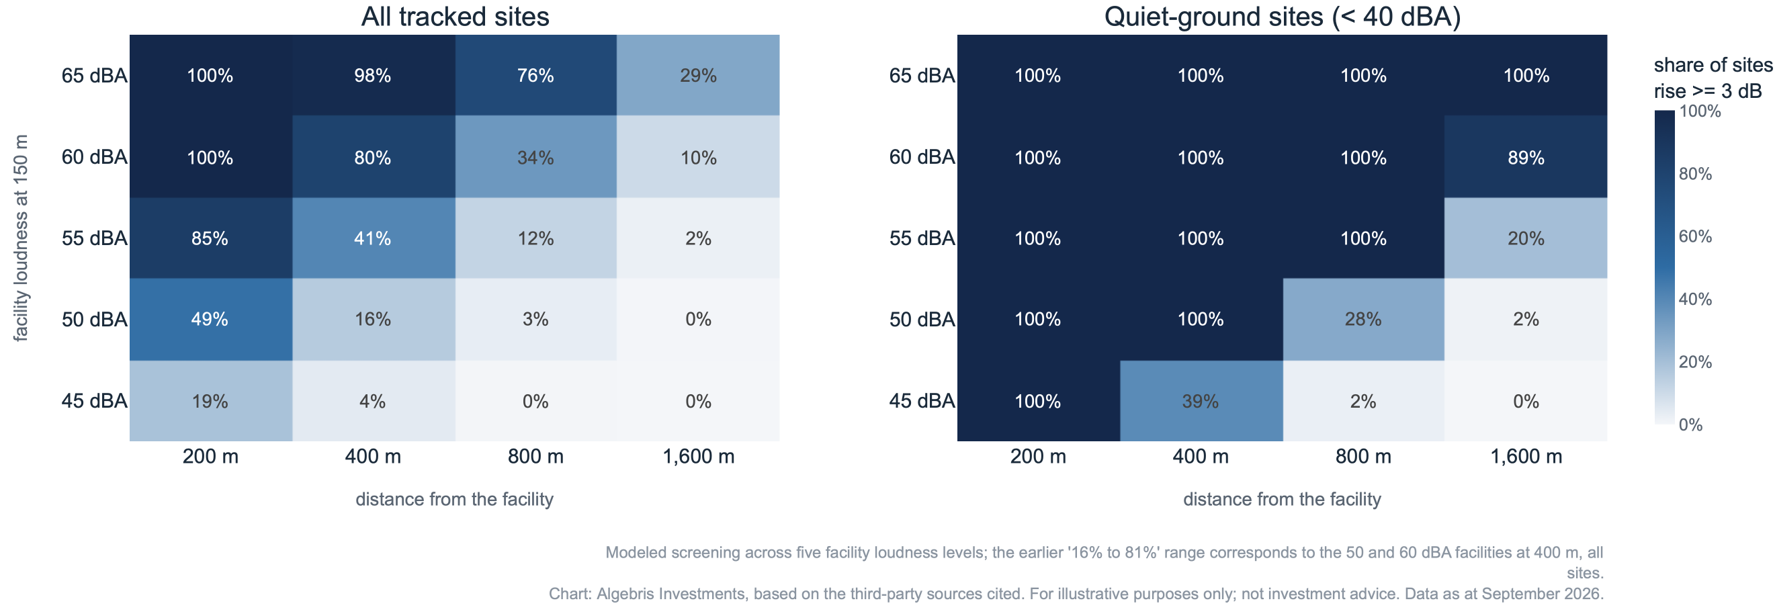
To understand how data centres buildouts could affect political sensitivities at the local level, we run a what-if exercise for every site: If a typical data center facility opened there, how much louder would it be at a house a few hundred meters away?[14] We find that a typical facility would be clearly audible over quiet ground out to about 474 meters and a loud one to about a kilometer and a half (Figure 3) and a town whose edge lies within that range is deemed in earshot. Of the 2,884 tracked sites we tracked, 327 stand on quiet ground, 95 of those have a town within earshot of a typical facility, and those 95 border 49 towns3,9. According to our estimates, roughly 3,700 people live inside a typical facility’s footprint across those sites, and the median exposed town has about 7,400 residents3.
The Sound of Progress
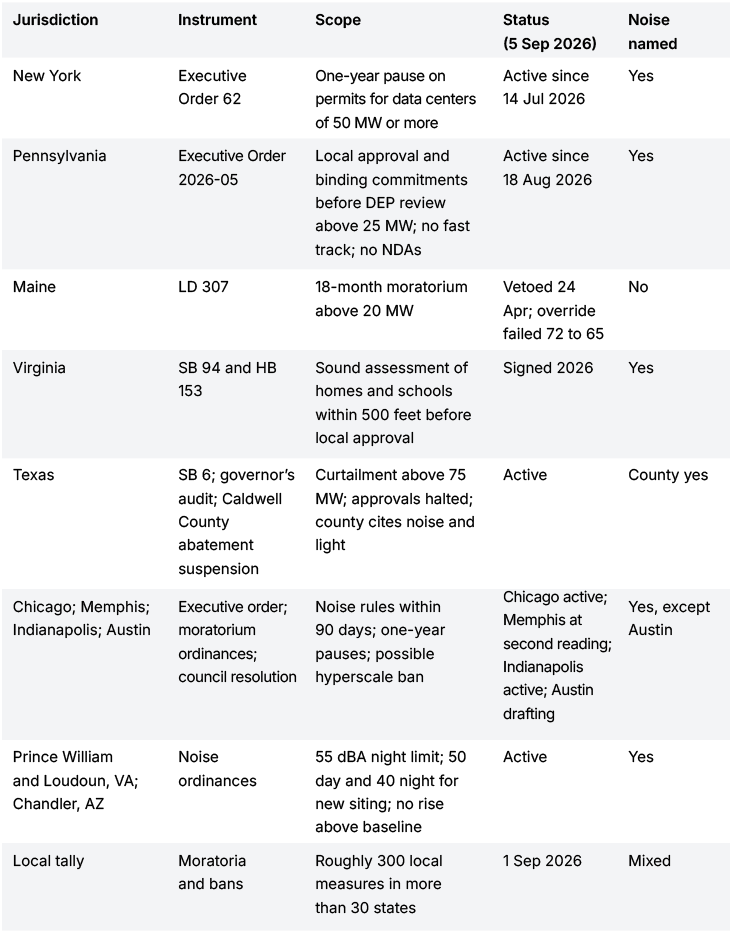
While no federal level guidance exists on noise pollution since the Reagan administration defunded the EPA’s Office of Noise Abatement and Control in the 1980s, the issue is regulated at the local level through zoning ordinances and local initiatives against datacentres based on noise grounds have lately become more widespread.
In 2023 the city of Chandler, Arizona, wrote into its data center ordinance that a facility may not raise sound above the level measured before it was built2. On ground like the one occupied by most of today’s already active sites, a typical facility would barely register, whereas on quiet ground the same facility would roughly double the loudness a person hears 400 meters away, and it would hence most likely not be authorized.
In early summer 2026, residents in three small cities filed lawsuits against datacentres specifically on noise grounds – arguing that while the data centres meet zoning codes, the constant humming and vibrations cause property depreciation through the loss of quiet. Noise is also named in the preamble of the executive order Pennsylvania’s governor signed in August[15], which ties state permit review to local approval and binding commitments, removes data centres from the fast-track program and bars state agencies from nondisclosure agreements15.
So far, political debate around datacentres have concentrated around energy prices and environmental impact. But as the next wave of US data centres is being planned in quiet ground, noise could become a relevant driver of political scrutiny. Opposition may remain limited and largely local, but as the buildouts proceed scrutiny may increase. Restrictions that have started to appear at the local level – such as dedicated power provision and noise limits – may eventually become standard requirements.
Making data centres quieter comes with trade-offs. Liquid cooling reduces noise inside the building, but equipment outside can still disturb neighbors. Reducing that outdoor noise can mean using more water, while saving water can mean more noise and higher electricity use, especially in summer. Other ways to control the noise add cost. Developers therefore face a difficult balance between communities’ demands for quiet, water conservation and affordable power. How quiet liquid-cooled sites actually are for nearby people remains unclear. [16].
Once the unquestioned beacon of economic progress, datacentres have turned into an object of heated controversy. Technological improvements will shape the balance between these two extremes in the medium term, but for now, this argument is likely to get lost in the political noise.
ANNEX
AUTHORS:
Iacopo Esposito
Silvia Merler
Omar Om Hani
Guglielmo Villani
[1] Source: Goldman Sachs. (2026, August 7). Global AI investment is forecast to exceed $1 trillion in 2026. https://www.goldmansachs.com/insights/articles/global-investment-is-forecast-to-exceed-1-trillion-in-2026.
[2] Source: Emerson College Polling. (2025, December 18). https://emersoncollegepolling.com/december-2025-national-poll-trumps-approval-flips-since-start-of-the-year/ and (2026, July 23). July 2026 national poll. https://emersoncollegepolling.com/july-2026-national-poll-democrats-with-11-point-generic-ballot-advantage/; Fox News. (2026, July 27). Fox News poll: Cool your servers! Voters reject data centers. https://www.foxnews.com/politics/fox-news-poll-cool-your-servers-voters-reject-data-centers; Texas Politics Project. (2026, August 24). New UT/Texas Politics Project poll finds Talarico leading Paxton, Abbott leading Hinojosa, continued resistance to data centers. University of Texas at Austin. https://texaspolitics.utexas.edu/blog/new-ut-texas-politics-project-poll-finds-talarico-leading-paxton-abbott-leading-hinojosa-continued-resistance-to-data-centers-2. Note: Emerson asked an identical question of national voters in December 2025 (42% oppose) and July 2026 (63%). Fox News, 1,003 registered voters, 17 to 20 July 2026: 70% oppose a data center in their area and nearly eight in ten prefer slower construction to address environmental and community concerns. UT, 1,200 Texas registered voters, 5 to 13 August 2026: 57% oppose, 30% support; Republicans 45% support to 43% oppose; Democrats 15% to 75%.
[3] Source: Cook Political Report. (2026, August 20). 2026 Senate and governor race ratings, as mirrored by 270toWin. https://www.270towin.com/2026-senate-election/cook-political-report-2026-senate; BallotReady. (2026). 84% of state legislative seats are up for election in 2026. https://organizations.ballotready.org/research/2026-state-legislatures; Shonerd, D., & Miller, K. (2026, February 20). State data center legislation in 2026 tackles energy and tax issues. MultiState. https://www.multistate.us/insider/2026/2/20/state-data-center-legislation-in-2026-tackles-energy-and-tax-issues; White, J. (2026, August 21). Data centers are ‘redefining’ midterm races across Pennsylvania. Spotlight PA. https://www.spotlightpa.org/news/2026/08/data-center-midterm-legislative-elections-voters-shapiro-garrity-polls. Note: Cook moved Texas from Lean Republican to Toss-up on 20 August 2026; the governor ratings are the same mirror’s governor page; all ratings as retrieved on 5 September 2026 are held by Algebris Investments Responsible Investment and Policy Research. BallotReady counts more than 6,100 open state legislative seats across 46 states. MultiState counts more than 300 data center bills in more than 30 states in the first six weeks of 2026 after more than 200 in all of 2025. Spotlight PA reviewed campaign materials in potentially competitive districts and found data centers in at least 20 races, most framed around household utility prices. The nine states rated toss-up on 5 September 2026 are Alaska, Arizona, Georgia, Iowa, Michigan, Nevada, Ohio, Texas and Wisconsin; their shares of pipeline sites, announced megawatts and operating sites are computed from the FracTracker records, and their population share from U.S. Census Bureau. (2025). Annual estimates of the resident population for the United States, regions, states, District of Columbia, and Puerto Rico: April 1, 2020 to July 1, 2025. https://www.census.gov/data/tables/time-series/demo/popest/2020s-state-total.html.
[4] Source: Javaid, M. (2026, September 5). Voters are fed up with data centers. Both parties are trying to cash in for midterms. NPR. https://www.npr.org/2026/09/05/nx-s1-5913671/ai-data-center-campaign-spending.
[5] Source: Shapero, J., & Frazin, R. (2026, August 22). Swing state candidates battle over data centers. The Hill. https://thehill.com/homenews/campaign/6044618-ai-data-center-backlash-michigan-ohio-pennsylvania
[6] Source: Associated Press. (2026, August 20). Trump keeps embracing data centers, an unpopular topic in midterm races. PBS News. https://www.pbs.org/newshour/politics/trump-keeps-embracing-data-centers-an-unpopular-topic-in-midterm-races; CNBC. (2026, September 1). Pa. Gov. Shapiro says too many data center developers ‘don’t care about our communities’. https://www.cnbc.com/2026/09/01/data-center-pennsylvania-shapiro-trump.html. Note: the AP reports the President’s 19 August remark to technology and crypto executives at the White House, his earlier statement that it is “only fair” for the companies to shoulder their power costs, the voluntary pledge he has had tech companies sign, and the National Republican Senatorial Committee’s memo of 18 August, whose quotations and its preferred picture of a project (built only with a local vote and paying for its own power, water and utilities) are as the AP reproduces them. CNBC quotes the President’s 31 August post and carries the governor’s remarks on Squawk on the Street the next day.
[7] Note: we crawled the campaign websites of 34 Senate and governor candidates in Georgia, Pennsylvania, Texas, Ohio, Michigan, Arizona, Nevada, Iowa, North Carolina, Virginia, Maine and Nebraska on 5 September 2026; 33 sites resolved, and we read the home page and up to eight issues pages of each. Counts are exact matches of “data center(s)” in visible text, so a zero means the phrase is absent from those pages, not that the candidate has no position. Mentions: Hinojosa (Texas governor, D) 18; El-Sayed (Michigan Senate, D) 7; Sand (Iowa governor, D) 4; Garrity (Pennsylvania governor, R) 4; Benson (Michigan governor, D) 2; Ramaswamy (Ohio governor, R) 1; all others 0. The quotations are verbatim from those pages, whose addresses are recorded by Algebris Investments Responsible Investment and Policy Research. Table 1 was compiled by Algebris Investments Responsible Investment and Policy Research from the instruments’ texts and official announcements, with each row’s status and source recorded as of 5 September 2026.
[8] Source: Genkina, D. (2025, October 13). Next-gen AI needs liquid cooling. IEEE Spectrum. https://spectrum.ieee.org/data-center-liquid-cooling. Note: IEEE Spectrum describes the facility water of a liquid-cooled hall being cooled by a chiller or by a dry cooler, an outdoor unit that uses fans to blow ambient air over the water.
[9] Source: Bloomberg Businessweek. (2026, August 26). Data centers are infamously noisy and calling the sound experts to help. Bloomberg. https://www.bloomberg.com/news/articles/2026-08-26/data-centers-are-infamously-noisy-and-calling-the-sound-experts-to-help
[10] Source: Seets, S., & Radde, K. (2026, April 13). Most new data centers in the U.S. are coming to rural areas. Pew Research Center. https://www.pewresearch.org/short-reads/2026/04/13/most-new-data-centers-in-the-us-are-coming-to-rural-areas/; Levy, M. (2026, August 26). Here’s all the ways that data center controversies have transformed the midterm elections. Associated Press, via U.S. News & World Report. https://www.usnews.com/news/business/articles/2026-08-26/heres-all-the-ways-that-data-center-controversies-have-transformed-the-midterm-elections. Note: Pew classifies counties with the Census Bureau’s urban-rural scheme: 67% of planned data centers are in rural counties, 87% of operating ones in urban counties, and 39% of planned data centers are in counties that have none today.
[11] Note: Quiet ground is a baseline below 40 dBA, tested at 35 and 45; the level descriptors (40 dB a quiet library, 50 moderate rainfall, 60 conversation) follow the American Academy of Audiology chart; the what-if lets sound fall 6 dB per doubling of distance from the 150 m benchmark and adds it to the map’s level, so the typical facility stays above 45 dBA to 474 m and the loud one to about 1.5 km; the pipeline sits 4.6 dB quieter than the operating fleet by the Hodges-Lehmann shift, with 19% against 3% on quiet ground at the main line and 51% against 14% at the loose one; among sites that publish a size, quiet ground holds 16% of facilities and 40% of announced megawatts; the typical facility raises the level at 400 m by a median 9.6 dB on quiet ground and 2.5 dB over all sites; and the A-weighted decibel scale removes about 26 dB at 63 Hz, the band where the hum concentrates. The independent validation of the sound map and the low-frequency review are documented by Algebris Investments Responsible Investment and Policy Research. Rural and quiet are separated with the 2020 population grid: at the operating fleet’s mix of local density (residents within 2 km of the site) the pipeline’s quiet-ground share would be 7% rather than 19%, against 3% for operating sites, and within every density band the pipeline’s median baseline is 1 to 3 dB below the operating fleet’s.
[12] Source: Mennitt, D., Sherrill, K., & Fristrup, K. (2014). A geospatial model of ambient sound pressure levels in the contiguous United States. The Journal of the Acoustical Society of America, 135(5), 2746–2764. https://doi.org/10.1121/1.4870481 (rasters: NPS IRMA DataStore reference 2217356); FracTracker Alliance. (2026, August). U.S. data centers tracker [Data set]. https://fractracker.org/data-centers/; Pacific Northwest National Laboratory. (2026). IM3 open-source data center atlas [Data set]. https://im3.pnnl.gov/datacenter-atlas. Note: the map gives the median summer daytime sound level of every 270 m cell, fitted to about 500 monitoring sites measured around 2014 and earlier. FracTracker: 1,679 records as sampled, of which 601 operating and 927 proposed or permitted sites fall on the map; IM3: 1,205 existing facilities after deduplication (© OpenStreetMap contributors, ODbL). The Umatilla count is the 24 tracked facilities whose nearest Census place is Umatilla, Oregon. The model has not been re-estimated since. The Bureau of Transportation Statistics’ National Transportation Noise Map is newer (aviation and rail data for 2022, roads for 2023, released May 2026) but covers only those three sources, so it cannot replace a map of total ambient sound (Bureau of Transportation Statistics. (2026). National Transportation Noise Map: Noise data 2022 [Data set]. U.S. Department of Transportation. https://catalog.data.gov/dataset/noise-data-2022). Growth since 2014 raises true levels above the modeled ones where the country has expanded, which biases the count of quiet sites upward, not downward.
[13] Source: Joint Legislative Audit and Review Commission. (2024). Data centers in Virginia (Report No. 598). Commonwealth of Virginia. https://jlarc.virginia.gov/landing-2024-data-centers-in-virginia.asp; City of Chandler. (2023, January 5). Chandler’s data center ordinance now in effect [Ordinance No. 5033]. https://www.chandleraz.gov/news-center/chandlers-data-center-ordinance-now-effect. Note: JLARC measured 40 to 59 dBA at residences near facilities that had drawn complaints; our three benchmark facilities, 45, 55 and 65 dBA at 150 m, bracket the published readings near operating facilities (method detail and the field survey behind the loud end are documented by Algebris Investments Responsible Investment and Policy Research). Chandler’s ordinance bars a data center from raising sound above its pre-construction level.
[14] For this exercise, we consider three benchmark facilities from Virginia: a quiet one at 45 decibels, a typical one at 55 and a loud one at 65, each at 150 meters from the facility’s fence. Each facility is treated as one steady source of sound at its fence, on open, flat ground with no obstacles in the way. Sound then fades by a fixed amount each time the distance from the fence doubles, and whatever reaches the home is added to the baseline sound that already exists there based on our 2014 map. This exercise is an obvious simplification of the real world. Real ground is rarely bare. Buildings and trees would trim the sound, while the largest campuses spread their cooling across a wide site and fade more slowly than a single source would, so the ranges should be taken as indicative of scale rather than accurate prediction.
[15] Source: Commonwealth of Pennsylvania, Office of the Governor. (2026, August 18). Bhakta, M. (2026, August 27). Shapiro, Garrity accuse each other of supporting data centers. The Hill. https://thehill.com/homenews/campaign/6055856-shapiro-garrity-pennsylvania-data-center-ads/. Note: the order’s preamble names “energy costs, noise pollution, and more”; it covers data centers with peak demand over 25 MW, requires local approval and binding commitments before Department of Environmental Protection review, removes them from the Permit Fast Track Program and makes non-disclosure agreements impermissible for state agencies (text fetched 5 September 2026). The Hill reports Amazon’s $20 billion for two campuses, the treasurer’s 2025 statement applauding it, her ad’s “sold us out” charge, the governor’s ad calling her “Pennsylvania’s No. 1 fan of data centers”, and an August New York Times/Philadelphia Inquirer/Siena poll with the governor 15 points ahead.
[16] Source: Genkina, D. (2025, October 13). Next-gen AI needs liquid cooling. IEEE Spectrum. https://spectrum.ieee.org/data-center-liquid-cooling; Han, Y., Li, P., Wierman, A., & Ren, S. (2026). Small bottle, big pipe: Quantifying and addressing the impact of data centers on public water systems. arXiv. https://arxiv.org/abs/2603.02705. Note: IEEE Spectrum describes rack power rising from about 8 kW to 100 kW for AI, the move to liquid cooling that follows, and the facility water being cooled by a chiller or by a dry cooler, an outdoor unit that uses fans to blow ambient air over the water. Han and colleagues estimate that US data centers could need 697 to 1,451 million gallons a day of new water capacity by 2030 and that limits on water push operators toward less efficient dry cooling, adding to summer peak electricity demand. Evaporation removes heat with less airflow than dry cooling does for the same load, so the fan power saved by using water is also noise saved.
For more information about Algebris and its products, or to be added to our distribution lists, please contact Investor Relations at algebrisIR@algebris.com. Visit Algebris Insights for past commentaries.
Any opinion expressed is that of Algebris, is not a statement of fact, is subject to change and does not constitute investment advice.
No reliance may be placed for any purpose on the information and opinions contained in this document or their accuracy or completeness. No representation, warranty or undertaking, express or implied, is given as to the accuracy or completeness of the information or opinions contained in this document by any of Algebris Investments, its members, employees or affiliates and no liability is accepted by such persons for the accuracy or completeness of any such information or opinions.
© Algebris Investments. Algebris Investments is the trading name for the Algebris Group.