
The ETS at a crossroad
The European carbon market, formally the EU Emissions Trading System (EU-ETS), is the world’s first and largest “cap-and-trade” market. It covers more than 10,000 installations across the European Economic Area in power generation, energy-intensive industry, shipping and aviation, together roughly 40% of the EU’s greenhouse-gas emissions[1]. The traded instrument is the EU Allowance (EUA), the purchase of which grants the right to emit one tonne of CO₂. Covered companies must surrender allowances against their emissions each year, and if they emit more than the credit they hold they must buy allowances, otherwise they can sell what they no longer need.
The aim of the ETS is to encourage regulated firms to invest in decarbonization by putting a price on emissions. In aggregate, the system has been successful: emissions from electricity generation and industry covered by the ETS have roughly halved compared to their 2005 levels. But when looking at the micro-level, the ETS so far has bound a minority of firms: only 40% of respondents report being net buyers of allowances (with ETS genuinely constraining their decisions) and only about 15% of firms say their largest emissions cuts are already behind them.
This is consistent with financial market evidence. While ETS compliance costs are estimated to raise significantly for regulated firms through 2030, our analysis of 2025 daily returns finds that European steel and cement shares responded roughly ten to thirty times more to a move in the broad equity market than to an equivalent move in the carbon price. In day-to-day trading, carbon is nothing more than a background noise – in line with the fact that companies mostly see their decarbonisation as a long-term goal.
Like all markets, the EU ETS sets the price based on demand-supply imbalance. Unlike most markets, however, a large potion of demand on the ETS does not contribute to price formation because it is met with free allowances. This mutes the price signal of the ETS and makes it strongly dominated by policy noise. When the largest carbon-policy shock in years hit the ETS market in February 2026, providing a good opportunity for an event study, equity reactions were large but idiosyncratic and poorly aligned with firms’ measured carbon exposure.
The EU ETS is now facing its most difficult credibility test, as free allowances for the EU industrial sector are phased out at a time when geopolitical turmoil drives volatility in energy prices. It is against this more complex economic and political landscape that the European Commission published its long-awaited ETS reform proposal. The reform paints a softer ETS for what is expected to be a harder decade – but it does not fully rid the system of policy uncertainty. As such, the signal the Commission is trying to send may soon get lost in yet more political noise.
A softer ETS for a Harder decade
The spirit of the Commission’s reform proposal is in line with the expectations the market had built off leaks earlier in the year. Overall, the stringency of the ETS will be reduced, and the tone shifts from one of predominantly punishing emissions to one of incentivizing decarbonization via greater investment funding, especially for industry.
The phase-out path for allowances will be slower – affording regulated sectors more time to decarbonise. The ETS operates through a declining cap on total emissions, which is reduced every year to drive the long-term decarbonisation of covered sectors. The annual reduction pace, known as the Linear Reduction Factor (LRF), stood at 4.3% in 2024 and was originally due to increase to 4.4% from 2028 under the EU’s “Fit for 55” legislative package. The reform proposes to lower the LRF to 3.7% in 2031-35 and 1.7% from 2036 – subject to certain conditions around international carbon credits (discussed below) being met. This pushes forward the sunset date for the system, with new allowances being issued well into the 2040s as opposed to a hard cliff hitting in 2039.
The available supply of emission allowances will be larger, for longer. Because verified emissions of regulated sectors have historically tracked below the cap, that long-running gap has built up a stock of surplus allowances. Under the original ETS structure, 24% of this surplus was being absorbed by the Market Stability Reserve (MSR) – a mechanism that automatically withdraws allowances from auctions when the circulating surplus is large – and allowances in the reserve exceeding 400 million were permanently cancelled. Under the Commission’s proposal, the intake rate in the MSR is halved to 12% and there will be no cancellation of reserves, with excess reserves being kept in the MSR as a permanent buffer to handle future supply shocks or price volatility.
Flexibility will be further increased by the Commission’s change of stance on the use of carbon credits. While historically the use of international offset had not been allowed within the ETS, this reform for the first time recognizes a role for offsets in the EU long-term climate strategy. The Commission proposes to integrate up to 250 million tonnes of domestic permanent carbon removals into the ETS between 2031 and 2040 for hard to abate sectors, and to procure up to 260 million tonnes of high-integrity international credits between 2036 and 2040.
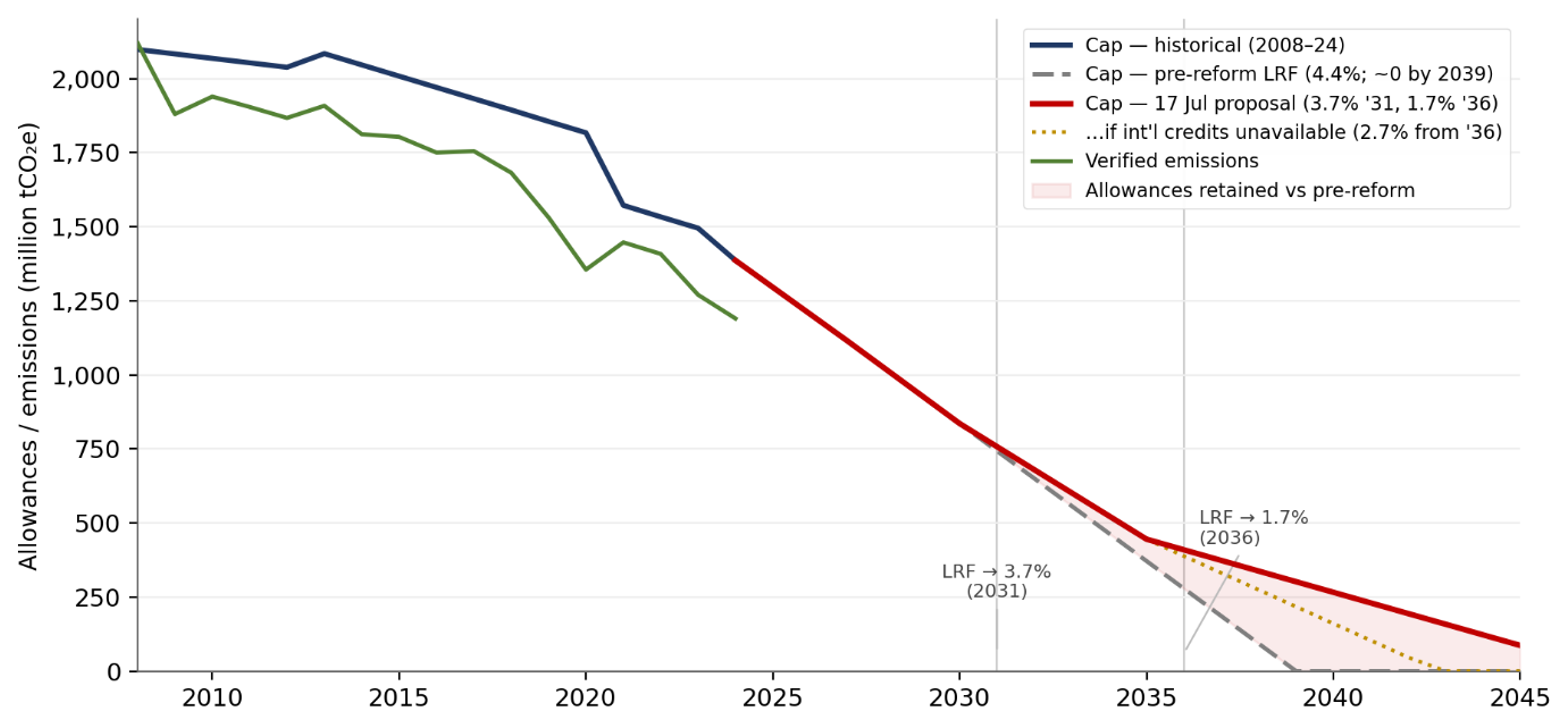
Figure 1. EU ETS cap vs verified emissions, 2008–2045 – pre-reform vs 17 July 2026 proposal – the Commission’s proposal steepens the linear reduction factor to 3.7% from 2031 and 1.7% from 2036, cutting the cap to ~0 by ~2043 versus ~2039 under the pre-reform 4.4% trajectory, with allowances retained falling to near-zero if international credits become unavailable. Source: Algebris based on EU Commission (COM(2026) 616 final))
The spirit of the Commission’s reform proposal is in line with the expectations the market had built off leaks earlier in the year. Overall, the stringency of the ETS will be reduced, and the tone shifts from one of predominantly punishing emissions to one of incentivizing decarbonization via greater investment funding, especially for industry.
The phase-out path for allowances will be slower – affording regulated sectors more time to decarbonise. The ETS operates through a declining cap on total emissions, which is reduced every year to drive the long-term decarbonisation of covered sectors. The annual reduction pace, known as the Linear Reduction Factor (LRF), stood at 4.3% in 2024 and was originally due to increase to 4.4% from 2028 under the EU’s “Fit for 55” legislative package. The reform proposes to lower the LRF to 3.7% in 2031-35 and 1.7% from 2036 – subject to certain conditions around international carbon credits (discussed below) being met. This pushes forward the sunset date for the system, with new allowances being issued well into the 2040s as opposed to a hard cliff hitting in 2039.
The available supply of emission allowances will be larger, for longer. Because verified emissions of regulated sectors have historically tracked below the cap, that long-running gap has built up a stock of surplus allowances. Under the original ETS structure, 24% of this surplus was being absorbed by the Market Stability Reserve (MSR) – a mechanism that automatically withdraws allowances from auctions when the circulating surplus is large – and allowances in the reserve exceeding 400 million were permanently cancelled. Under the Commission’s proposal, the intake rate in the MSR is halved to 12% and there will be no cancellation of reserves, with excess reserves being kept in the MSR as a permanent buffer to handle future supply shocks or price volatility.
Flexibility will be further increased by the Commission’s change of stance on the use of carbon credits. While historically the use of international offset had not been allowed within the ETS, this reform for the first time recognizes a role for offsets in the EU long-term climate strategy. The Commission proposes to integrate up to 250 million tonnes of domestic permanent carbon removals into the ETS between 2031 and 2040 for hard to abate sectors, and to procure up to 260 million tonnes of high-integrity international credits between 2036 and 2040.
Figure 3. EU steel, cement & airline share-price sensitivity to the market vs the carbon price, 2025 — from one multi-factor model, equities move ~11–13% on a +10% market move but under ~1% on a +10% carbon move. Dated as at 31 December 2025
The market barely took notice. The front-December emission allowance contracted a mere 0.9% to €78.46 per tonne as details emerged, against a 25% decline off the rumors back in February. In part, this reflects the fact that much of the content had been signaled in advance – over months of intense political confrontation on the ETS. At the same time, many of the changes in the reform apply after 2030, at the thin, far end of the curve, while the parameters governing the front contract are left largely intact. The proposal’s principal effect on price formation is to push scarcity further out and reduce the risk of a disorderly adjustment, so the real test of how seriously the market takes it will be in whether the back end of the term structure cheapens relative to the front going forward.
Lastly, it is far from assured that the reform will be enacted as it has been proposed. The European Parliament aims to vote by the end of 2026, in what Politico has already billed as the “biggest climate fight of 2026”. The key elements in the reform remain negotiable in trilogue – including key market movers such as the 3.7% to 1.7% calibration, and the contingencies triggering a reversion of the LRF up to 2.7%. The initial market response provides little evidence that investors attached particular importance to the proposal, but as we will discuss in the next section this is a market that reacts structurally more to policy uncertainty than to fundamentals. While reform proposal validated many of the expectations that the market had built over the past few months, the political process leaves ample room for uncertainty to strike back in the future.
Pricing Carbon, or Policy Uncertainty?
For the ETS to deliver its policy objective, the price of carbon needs to send a meaningful economic signal. This requires supply on the market for emission allowances to be structurally tighter than demand. But today, the EU industry largely covers its emissions with free allowances it receives to prevent ‘carbon leakage’ (i.e. delocalization of production to jurisdictions with more lenient carbon laws). Unlike on most other markets, on the ETS a large portion of demand is met for free and does not contribute to price formation. This has two implications.
First, free allocations limit carbon leakage, but they also mute the price signal the system is designed to send. Climate policy think-tankE3G estimates the average effective carbon cost for sectors deemed at risk of leakage at less than €2 per tonne of CO₂ over 2021–2024[2], while a European Investment Bank survey of ETS-regulated firms finds that only around 40% were net buyers of allowances – suggesting the system has so far been cost binding for just a minority of firms[3].
To further illustrate this point, we focus on cement and steel. Both covered by CBAM, these are the two largest emitting industrial sectors in the system (accounting together for nearly half of all covered industrial emissions) and have free-allocation coverage that is high today but falls fastest under the CBAM factor. Is this visible in equity prices? Figure 3 estimates how each sector’s shares respond independently to a 10% move in various market drivers. We include cement, steel and airlines – as a counterfactual. Aviation’s free allocation was cut by 25% in 2024 and 50% in 2025, and the sector’s allowances are fully auctioned from 2026, so airlines pay for carbon in cash today in a way steel and cement will not until the early 2030s. If carbon exposure were being priced into equity valuations, airlines should be the first place to see it. According to the estimates shown in Figure 3, a 10% rise in the broad market is associated with similarly sized sector moves of 11–13%, while a 10% rise in the carbon price is associated with moves of just +1.1% for steel, +0.4% for cement and +0.6% for airlines (which are therefore virtually indistinguishable from the sectors that still receive free allowances).
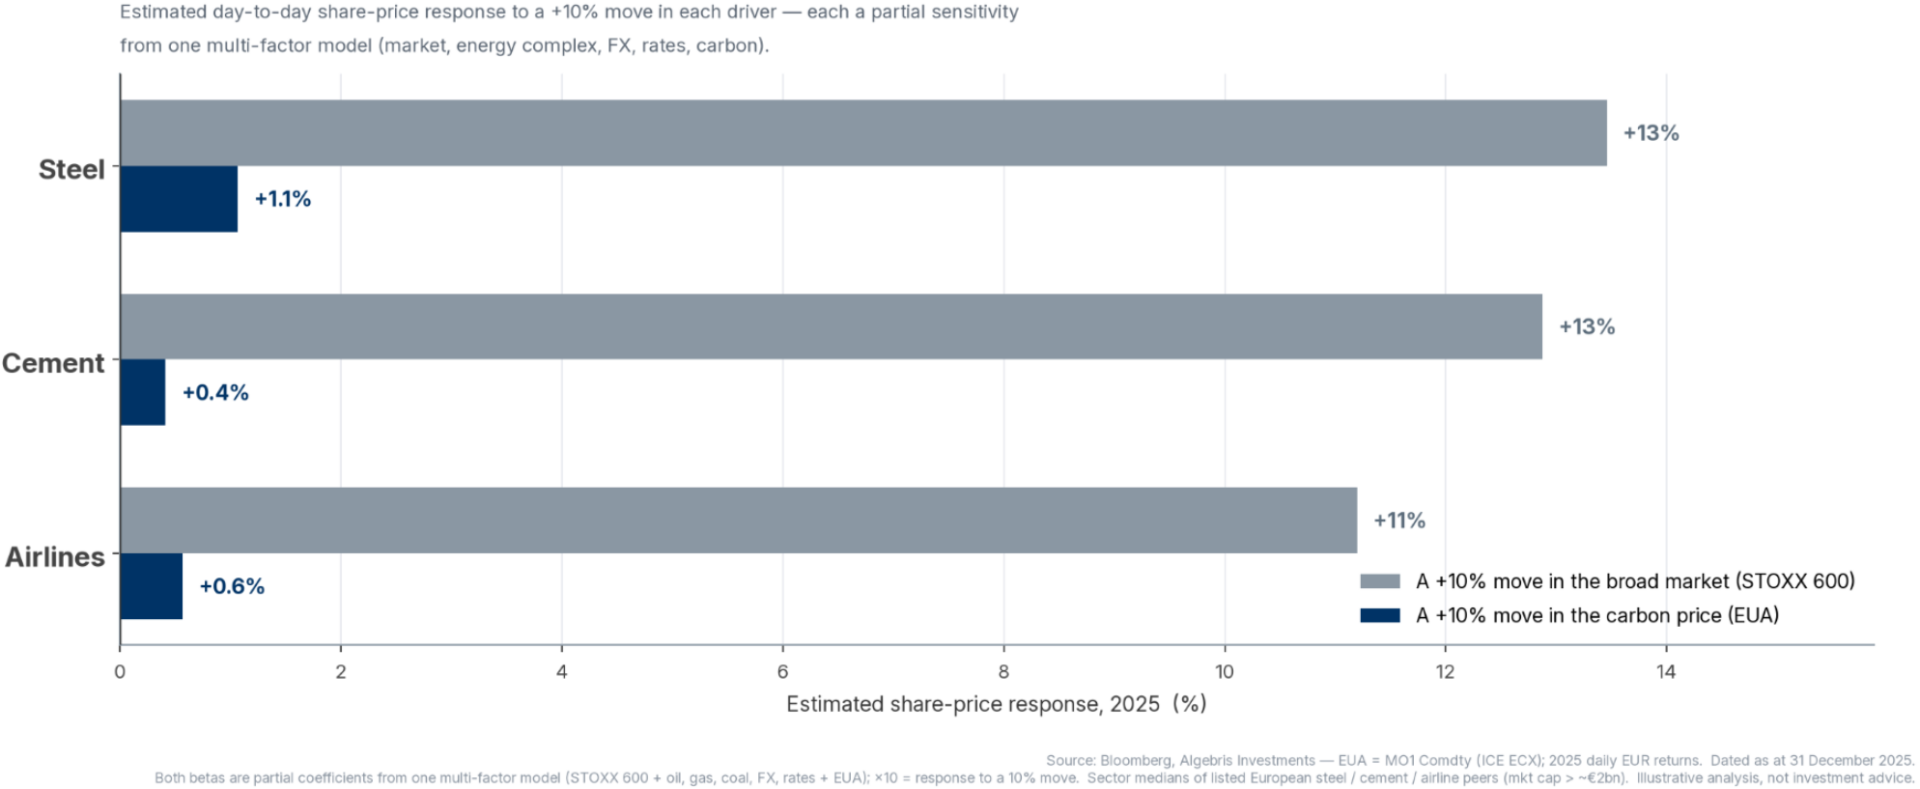
Figure 3. EU steel, cement & airline share-price sensitivity to the market vs the carbon price, 2025 — from one multi-factor model, equities move ~11–13% on a +10% market move but under ~1% on a +10% carbon move. Dated as at 31 December 2025[4]
A few qualifications are needed. First, the ETS so far covers only intra-EEA flights, so the share of an airline’s emissions it captures varies widely: roughly three quarters for point-to-point low-cost carriers, but only around a fifth for long-haul network carriers2. Second, airlines have generally been able to pass carbon costs into ticket prices. A near-zero reading is therefore consistent with two explanations: markets are ignoring a cost that is already being paid, or pass-through is insulating earnings from it. Which of the two is right matters for steel and cement, where pass-through ability is far less uniform. Cement is regionally priced and costly to move, demand is relatively price-inelastic, and the sector repriced successfully through the 2021–2023 energy-cost shock. Steel has instead is priced globally against persistent Chinese overcapacity, roughly a fifth of EU output is exported with no CBAM rebate on the way out, and the mechanism’s initial scope covers the commodity but not every downstream fabricated product that competes with it.
Second, because supply is written into law, this is, at its core, a policy-driven price. Regulatory news, and shifts in political sentiment have repeatedly driven sharp moves in the price of EU emission allowances – at times detaching it from the underlying path of emissions and industrial activity. The result is a market that while anchored by fundamentals over the long run can be episodically dominated by wild swings and uncertainty. Figure 4 illustrates this by plotting five and a half years of the front-month EUA price against its 30-day realized volatility, the annualised standard deviation of daily returns over a rolling month. One of the most instructive illustrations occurred on 7 February 2026, when a draft of the 2026–2030 free-allocation benchmarks leaked to the press5. This included the first concrete data points on how the phase-out of free allowances would be distributed across individual installations. The market reaction was swift and sizeable: the EUA price fell by ca. 25% into its trough on 12 February, as participants rapidly repriced the supply outlook in response to information that had, until that point, been unavailable to the public.
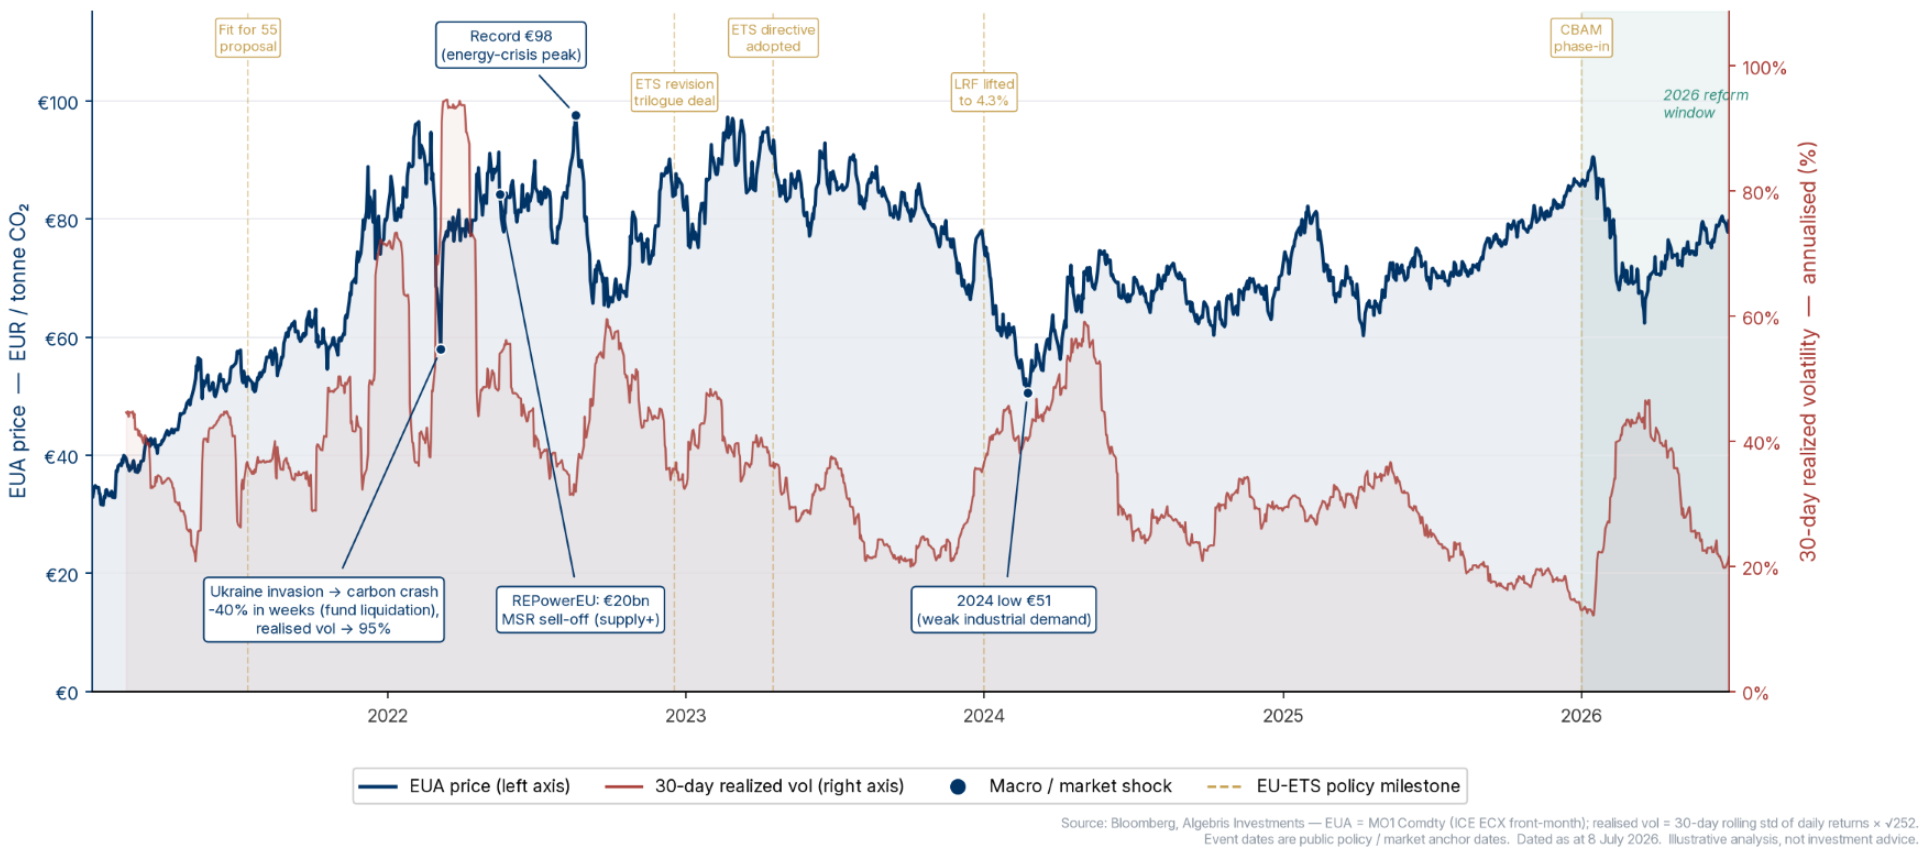
Figure 4. EUA price and 30-day realized volatility, Jan 2021 – Jun 2026 — front-month EUA against rolling realized vol, policy milestones and macro shocks marked. Dated as at 30 June 2026[5]
A 25% move in a firm’s marginal compliance cost is a material earnings event for an under-allocated emitter. In a market where the price signal bears economic meaning, one would expect this to impact equity prices of the firms expected to benefit most from a cheaper allowance. But according to an analysis of STOXX 600 firms with significant EU-ETS exposure run by carbon market intelligence firm Transition Metrics, the equity moves on 12 February bore little relationship to each firm’s estimated earnings sensitivity to the carbon-related event: some heavily exposed names barely moved, while some names with modest measured exposure fell sharply2. Figure 5 shows an aggregate version of the same point by comparing the price dynamics of the EUA with those of the equity of a pool of EU industrial companies. Since the shock, firms in the iShares MSCI Europe Industrials UCITS ETF have recovered to +11% year to date while the EUA remains down 8%, with a daily correlation of only ~0.25.
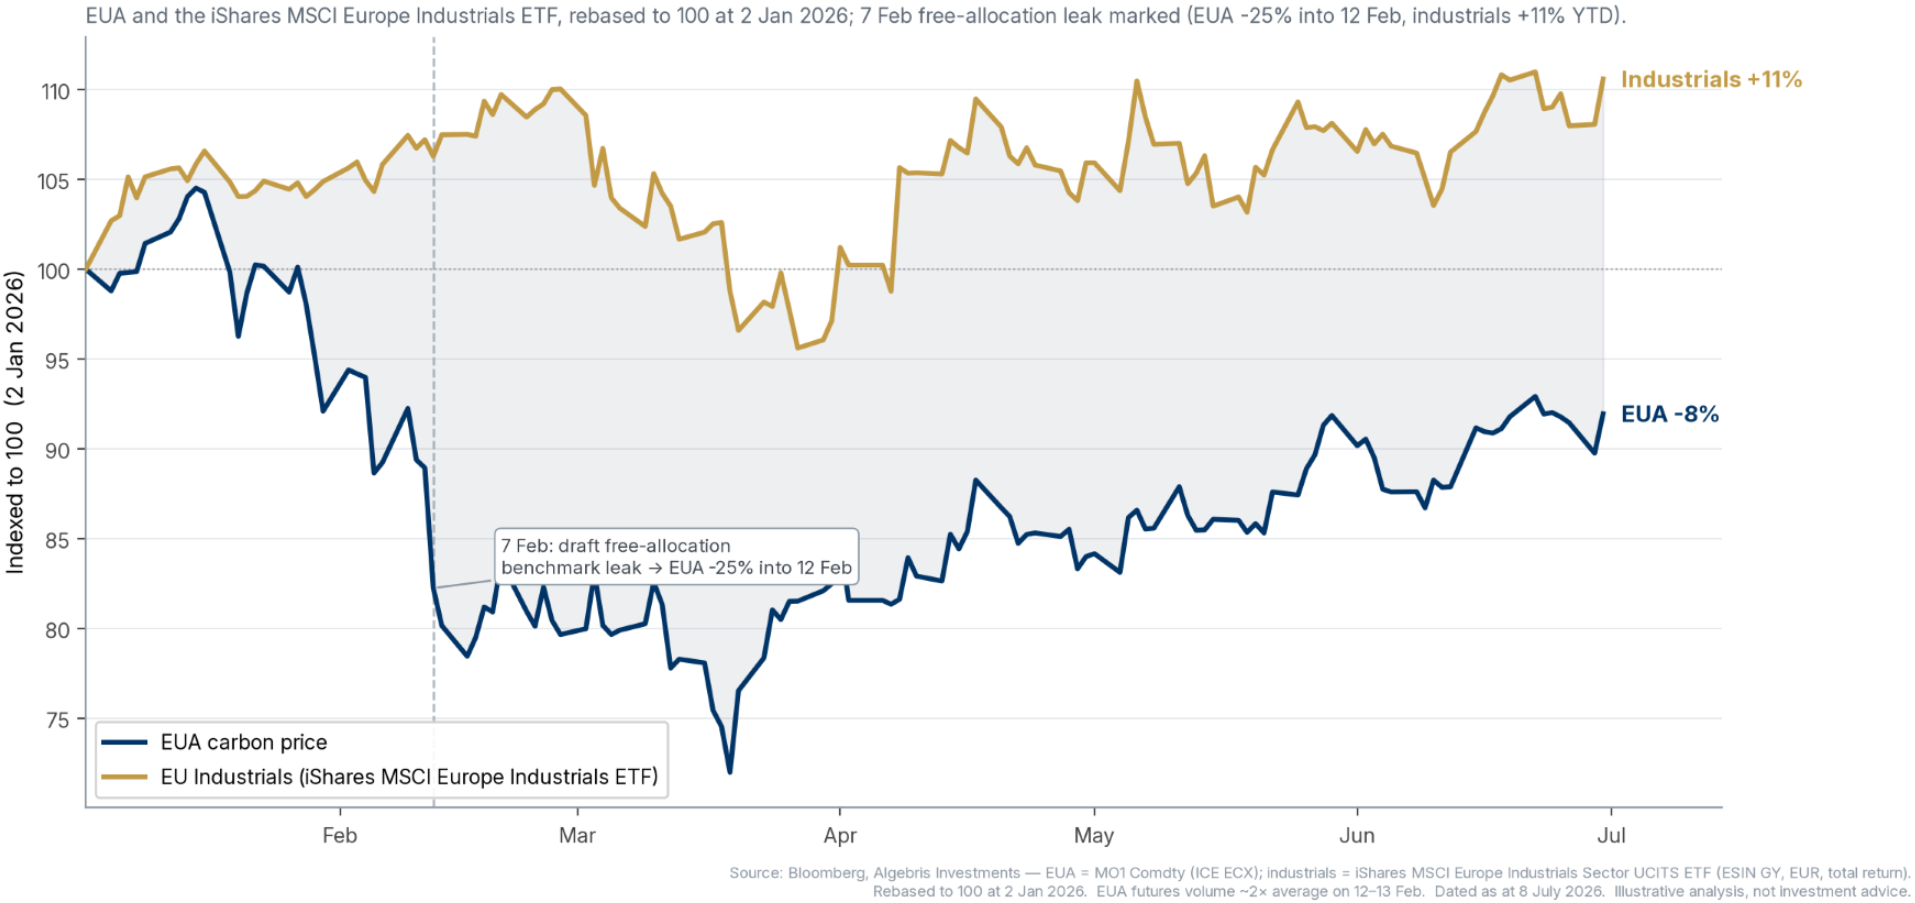
Figure 5. EUA price vs EU industrials, 2026 (rebased to 100) – EUA −8% YTD vs the iShares MSCI Europe Industrials ETF +11% YTD, 7 Feb free-allocation leak marked. Dated as at 30 June 2026[6]
This analysis undoubtedly has some limitations. First, equities discount long horizon earnings rather than spot commodity prices, so low daily co-movement between share prices and the EUA is not, by itself, evidence of neglect. Secondly, most of the ETF’s constituents carry little direct carbon exposure, so the firm-level evidence is the more informative of the two. Lastly, the muted response may reflect judgment rather than inattention: investors may be anticipating that the phase-out will be delayed or diluted, in which case the costs at stake would never fully materialise (a view the July 2026 reform proposal has partially vindicated).
Yet, if the market were consciously discounting policy relief, reactions to policy news should still show some correlation with each firm’s exposure, and in February this was not the case. There is a simpler possibility: with an effective carbon cost of under EUR 2 per tonne to date, there has been very little for the market to price for these sector and equity markets rightly appears to treat carbon as background noise rather than a firm-specific risk factor.
A matter of Inflation
The reform will likely lower carbon prices in the short-medium term, but will not move the needle on inflation. The macroeconomic footprint of the ETS runs almost entirely through energy prices, specifically electricity,reflecting the fact that power and heat generation accounted for roughly half of ETS1 emissions in 2024 and that the power sector is the largest single purchaser of auctioned allowances. For industry, as discussed, the direct cost is heavily muted by free allocation and the empirical pass-through is highly variable. For retail fuels the relevant instrument is not ETS1 but the forthcoming ETS2.
The Eurosystem incorporates the ETS into its inflation projections in two ways. ETS1 enters as a technical price assumption: a synthetic EUA price feeds into the projections through electricity and input costs. In December 2025 the ECB assumed a carbon price of EUR 82.8/t in 2026, EUR 85.1/t in 2027 and EUR 87.7/t in 2028. This sits above both the abnormally low EUA curve the markets priced in February off the political noise around scrapping the ETS altogether, and the current curve priced after the reform proposal of July 17 (Figure 6).
A recent IMF study (Konradt, McGregor and Toscani 2024) finds that raising the effective carbon price by roughly EUR 110/t, would add between 0.2 and 0.4 percentage points to annual euro-area inflation. Applying the IMF’s implied elasticity (approximately 0.0018 to 0.0036 percentage points of HICP per EUR 1/t) to the gap between current prices and the prices assumed in the ECB forecasts yields a negligible downward adjustment to estimated ETS1 inflation contribution, of roughly 0.006 to 0.016 percentage points per year over 2026–2028.
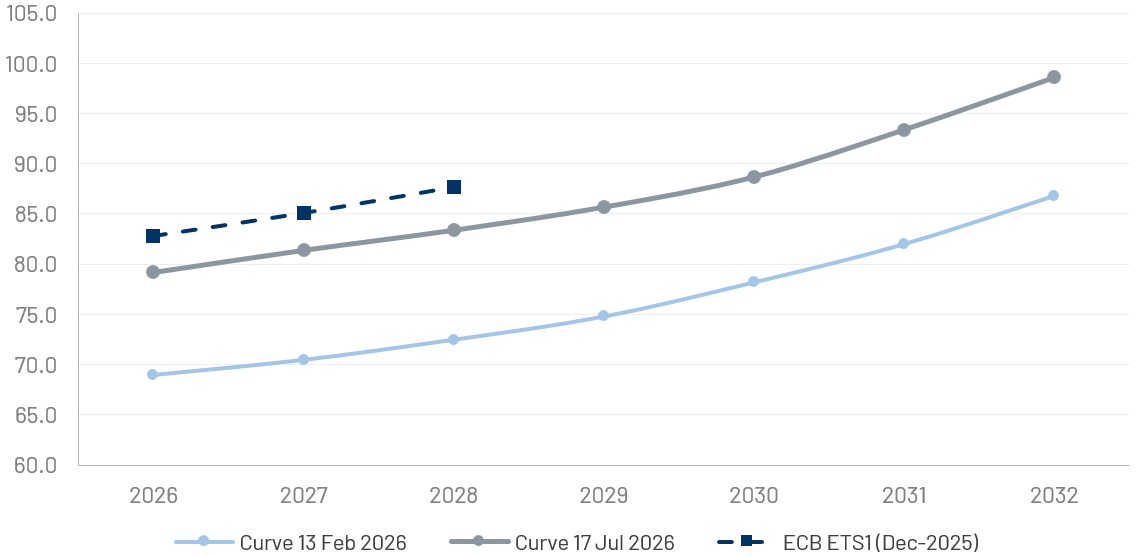
Figure 6. EUA curves assumed in the ECB in its projections, versus historical curves. Source: ECB and Bloomberg Dated as at 17 July 2026.
ETS2, which enters the ECB framework as a discrete inflation event, has a much bigger impact on inflation. The December 2025 projections attach a +0.2 percentage-point impact on euro-area headline inflation in 2028 to the introduction of ETS2, which the ECB expects in 2028. The July reform does not alter the path or structure of ETS2, so it is relatively inconsequential overall for the assumptions that underpin the ECB’s estimates of ETS inflation. But because of large impact that ETS2 is forecasted to have on inflation, this may become the next political bone of contention, and the ETS2 timeline may be where the next policy-driven volatility event materializes.
What’s next?
Since the war in Iran triggered higher energy prices, a heated political debate has unfolded in Europe around the trade-offs between decarbonization and competitiveness – which has found in the ETS a perfect culprit. Opponents of the ETS often argue that the system generates excessively high energy prices, but the dynamics of electricity prices remain dominated by fuel costs and Europe’s reliance on fossil fuels exposes its industry to wild swings. The debate tends to depict decarbonization and competitiveness as irreconcilable trade-offs, but recent geopolitical events have illustrated that, in the case of Europe, investing in industrial decarbonization is a way to foster resilience to the shocks that follow from lack of energy independence.
But for decarbonization, predictability is as (if not more) important as ambition: a recent EIB survey reveals that the single most-cited obstacle to decarbonization investment is uncertainty about future carbon prices and regulation. This reform is a balancing act laying out a softer ETS for what is expected to be a harder decade. It will most likely lead to lower and less biting carbon prices in the short to medium term – as the horizon for compliance stretches – but it is unlikely to dispel the policy uncertainty that has made this market prone to volatility in the past.
The ETS is designed ultimately to promote industrial CapEx reallocation by raising the cost of capital for carbon-intensive incumbents and rewarding those who decarbonize. So far, however, listed-equity valuations do not yet price carbon exposure as a firm-specific risk factor. This reflects on one hand the reality that decarbonisation happens on a longer-term horizon than what is material to daily returns, but also – we believe – the fact that the market has had little to price so far and may still lack a framework to convert carbon into a firm-level risk factor.
As a result, the longer-term outcome of this reform will hinge crucially on whether the revamped investment provisions are credible enough to deliver an incentive for firms to decarbonize even as the signal from carbon prices remain muted. In the meantime, price dynamics on the EU carbon markets are likely to remain dominated by political noise and policy driven volatility – which may soon resurface, as the ETS2 (whose impact on European inflation is expected to be much more material than that of ETS1) starts operating in 2028.
[1] Source: European Commission, Transition Metrics. (2026, February). *EU ETS: Carbon market evolution or revolution? * [Presentation].
Note: installation count and approximate share of EU emissions covered by the EU ETS.
[2] Source: Cătuţi, M., Waliszewska, A., & Vangenechten, D. (2026, June). *Maximising the investment power of the EU ETS* [Briefing]. E3G.
[3] Source: Revoltella, D., & Kalantzis, F. (2026, July 9). The EU emissions trading system works but most industrial decarbonization is still to come (Analysis No. 22/2026). Bruegel. https://www.bruegel.org/analysis/eu-emissions-trading-system-works-most-industrial-decarbonisation-still-come
[4] Source: Bloomberg L.P.; Algebris Investments.
Note: partial coefficients from a single multi-factor regression of 2025 daily EUR returns on the broad market (STOXX 600, SXXP), Brent crude (CO1), TTF natural gas (TZT1), coal (XAA), EUR/USD, Bund futures (RX1) and the EUA (MO1 Comdty), scaled to a 10% move in each driver. Sector medians of the listed European steel, cement and airline peer set with market capitalization above roughly €2bn. Contemporaneous daily sensitivities; sample period calendar 2025.
[5] Source: Bloomberg L.P.; Algebris Investments. Note: EUA is the ICE ECX front-month future (MO1 Comdty). Realized volatility is the 30-day rolling standard deviation of daily returns, annualized. Event dates are public policy and market anchor dates. Dated as at 30 June 2026.
For more information about Algebris and its products, or to be added to our distribution lists, please contact Investor Relations at algebrisIR@algebris.com. Visit Algebris Insights for past commentaries.
Any opinion expressed is that of Algebris, is not a statement of fact, is subject to change and does not constitute investment advice.
No reliance may be placed for any purpose on the information and opinions contained in this document or their accuracy or completeness. No representation, warranty or undertaking, express or implied, is given as to the accuracy or completeness of the information or opinions contained in this document by any of Algebris Investments, its members, employees or affiliates and no liability is accepted by such persons for the accuracy or completeness of any such information or opinions.
© Algebris Investments. Algebris Investments is the trading name for the Algebris Group.