
Over the past fifteen years, fiscal deterioration has been the elephant in the room. Following 2008-09, public debt has overtaken private leverage, and since then it has moved only one way (up). Global government debt now sits at 100% of GDP, compared to 57% in 2007 (Chart 1). Quantitative easing has paved the way for aggressive fiscal stimulus at various times since then (2010, 2015, 2020). When inflation materialized in 2022-23, fiscal policy remained loose but central banks’ support ceased. As a result, interest costs added to social spending and are now 3% of GDP in G10 countries (Chart 2). Primary deficits are 2-3% of GDP, which means that debt stabilization would require painful consolidation.
The increase in public debt can’t last forever. Eventually, governments will face a difficult choice between loss of confidence and a sudden fiscal adjustment. The coordinated steepening of yield curves experienced across G10 countries in 2025 is an alarming reminder of this fact. The US administration’s scramble for tariff revenues, together with the ongoing debates on tax hikes in the UK and France, suggest governments are taking notice. The problem is – traditional solutions are not available. The fiscal tightening required to balance budgets is not politically viable, and advanced economies can’t grow out of debt as deficits run at 5-6% and real growth at 1-2%.
This new set-up is bad news for savers. As governments struggle to balance debt ratios, they can’t afford to leave any premium on the table for investors. They thus face strong incentives to adopt policies that compress real yields. Interest rates below inflation means that debt can deflate even in the absence of growth. And consolidation is a long and painful path towards government deleveraging.
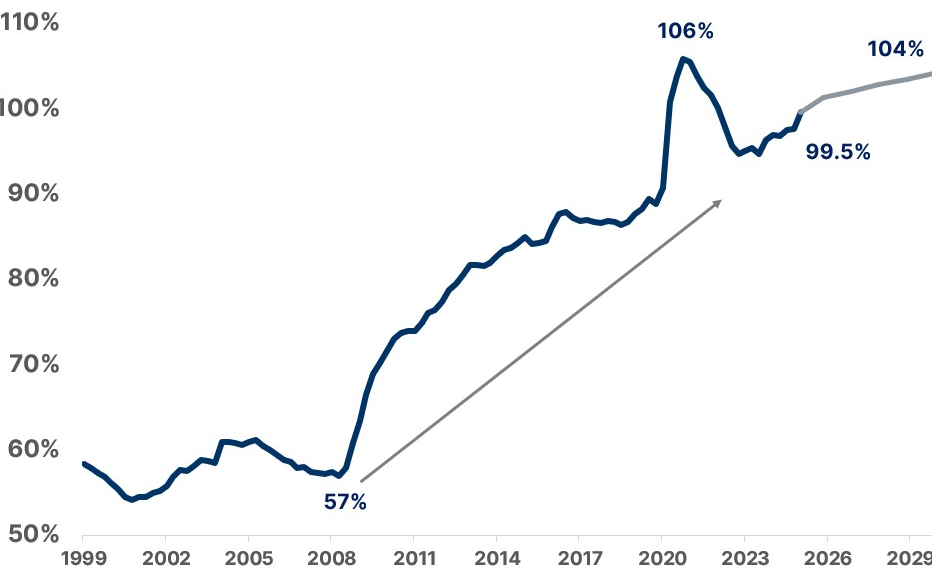
Global Government Debt as a % of GDP Source: IIF Global Debt Monitor. April 2025 Fiscal Monitor IMF. Note: Debt timeseries in computed with data from the IIF Global Debt Monitor. Projections come from IMF April 2025 Fiscal Monitor
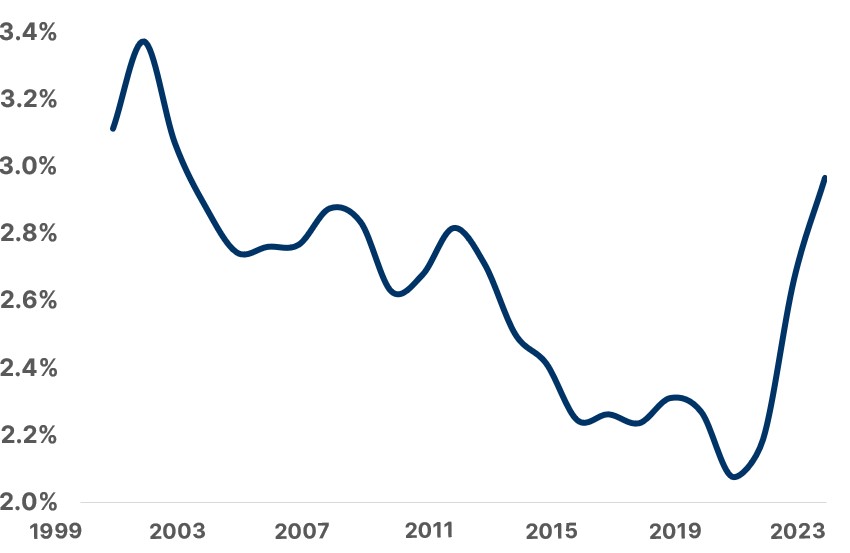
Interest Bill for G10 Countries as a % of GDP; Source: IMF Public Finances in Modern History Dataset. Data as of 2023. Note: GDP Data from the IMF World Economic Outlook (April 2025)
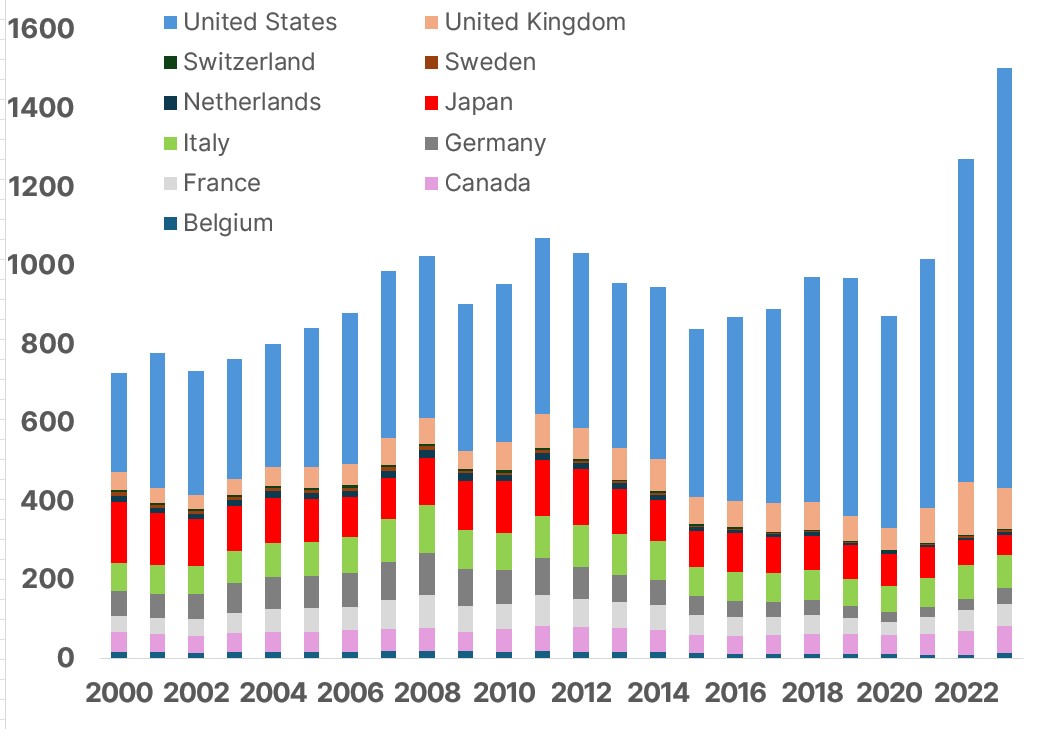
Interest Payment on Debt for G10 Countries, USD Bn; Source: IMF Public Finances in Modern History Dataset. Data as of 2023. Note: GDP Data from the IMF World Economic Outlook (April 2025)
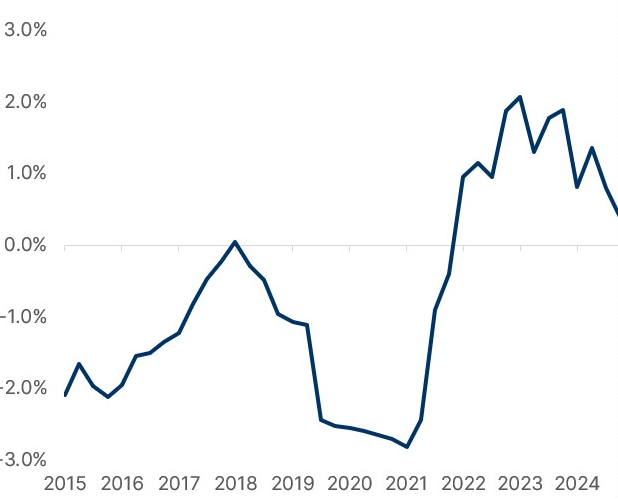
2Y US Real Rate. Note: US Federal Reserve Common Inflation Expectations (CIE) Michigan Alternative Source: US Federal Reserve, Algebris Investments, Bloomberg Finance L.P. Data as of 22.09.2025. BofA.
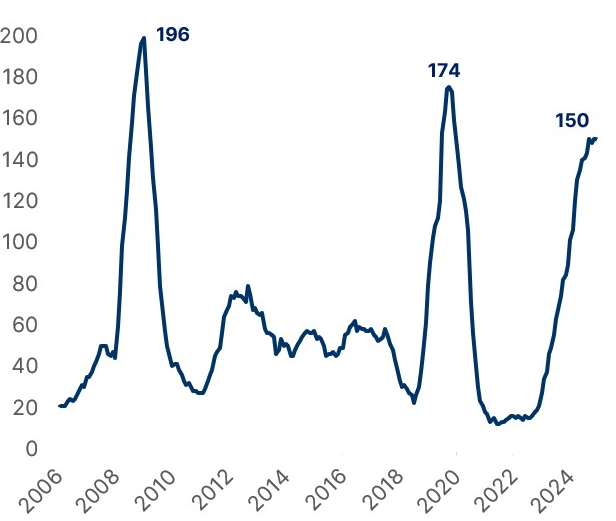
Global Central Bank Policy Rate Cuts (1Yr Cumulative). Source: US Federal Reserve, Algebris Investments, Bloomberg Finance L.P. Data as of 22.09.2025. BofA.
Financial repression is not new. Japan has explicitly controlled the yield curve since 2016. China has capped deposit rates for over thirty years. Europe, the US, and the UK shifted 20% of their debt stock to central banks’ balance sheets during the Covid crisis.
The trend is accelerating further as the world is moving from an institutions-based to a more pragmatic policy framework. In this context, it gets easier to implement financial repression policies. In the US, the SLR banking reform, new crypto regulation, and active Fed interference all push government bond yields lower than they should be. In Asia, policy rates have been kept artificially low for decades. In Europe, the ECB TPI program is designed to make sure fiscal gaps are not reflected in market prices. Front-end real yields have been falling across G10 economies for the past 12 months. 2025 saw a record number of cuts despite inflation broadly above target (Chart 3).
Markets have taken notice of the shift. In 2025, risk assets performed strongly despite a new unstable global order. In contrast, global curves have steepened, and long-dated bonds have lost money. Since 2022, losses in government bond markets have funded gains elsewhere (Chart 4). Precious metals keep staging impressive performances, particularly against the US Dollar. Central banks are shifting away from government debt and into gold (Chart 5).
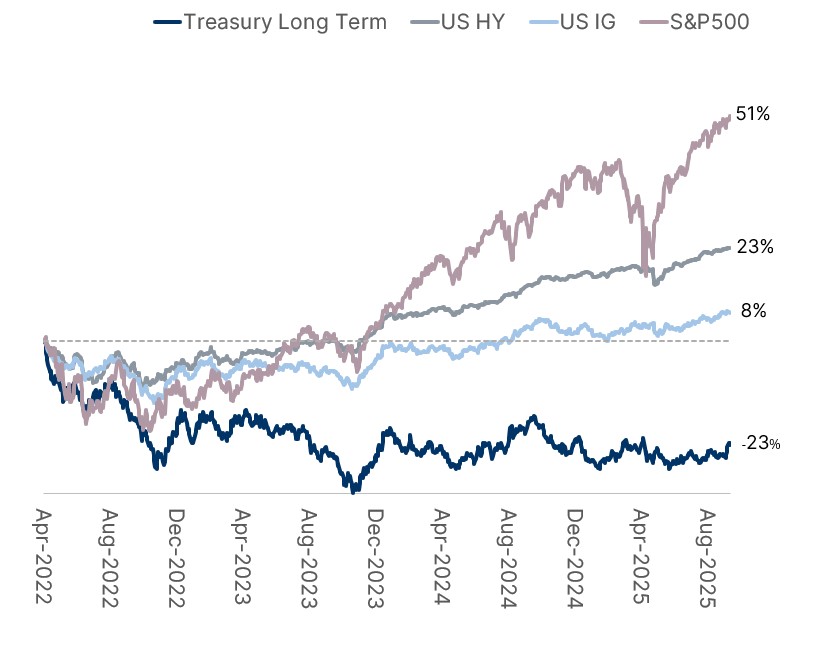
Total Returns from March 2022 (%). Source: Bloomberg Finance LP, Algebris Investments. Data as of 10.09.2025. Note: US HY is Bloomberg US Corporate High Yield Total Return Index Value Unhedged USD, US IG is Bloomberg US Corporate Total Return Value Unhedged USD IG Index, Treasury Long Term is iShares 20+ Year Treasury Bond ETF Class USD INC (U.S.).
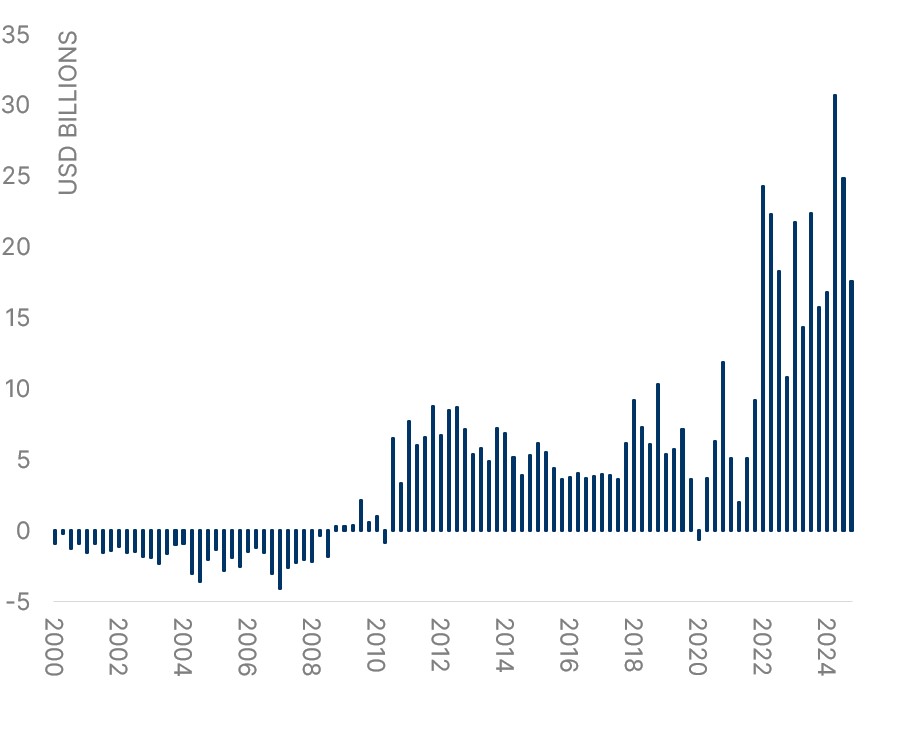
Central Banks Quarterly Net Purchases of Gold, USD Bn. Source: Metals Focus, Refinitiv GFMS, World Gold Council, Bloomberg Finance LP, Algebris Investments. Data as of 10.09.2025
Going forward, the problem for investors will be finding an adequate source of real yield. Investors will be forced to take more risk in credit markets to escape financial repression. Riskier credits, like banks, high-yields and emerging markets are set to become the only proper source of real income (Chart 6). Two-year Bunds yield 2%, compared to EZ core inflation running at 2.3%. The investment grade market pays just north of 3%. The high yield index pays 5.5%. When it comes to bonds, investors need to choose between risk premium and gradual, but certain, losses.
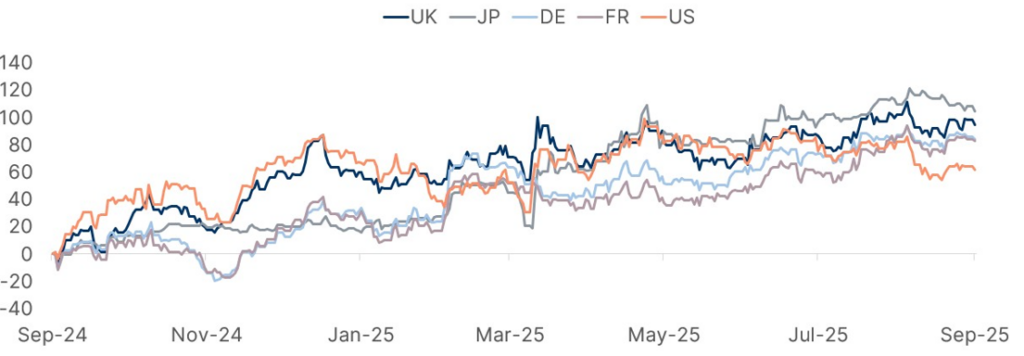
In this new world, credit has been a winner (Chart 7). Private corporates and sovereigns with limited market access can’t print their way out. Hence, they are (counterintuitively) safer, despite paying a spread over government bonds. In Europe, 60% of corporates now yield less than French debt. A few investment grade credits now trade flat to US Treasuries, both in the corporate and sovereign worlds. As markets re-assess the meaning of safe asset, “T-minus” becomes a fixed income mantra.
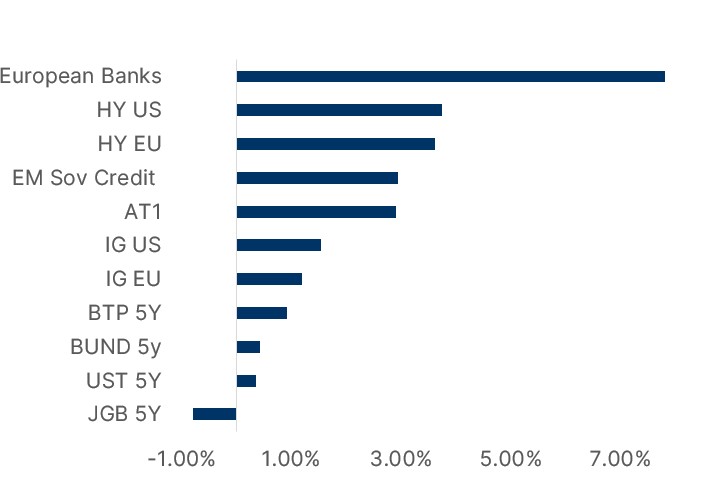
Chart 6 Source: Bloomberg Finance LP, Algebris Investments. Data as of 24.09.2025. Chart 7 (first) 30Y treasuries 12m cumulative yield changes in bps; Note: Generic 30Y cumulative bond yield changes (in basis points) vs 12-months prior are displayed Source: Bloomberg Finance LP, Algebris Investments. Data as of 10.09.2025.
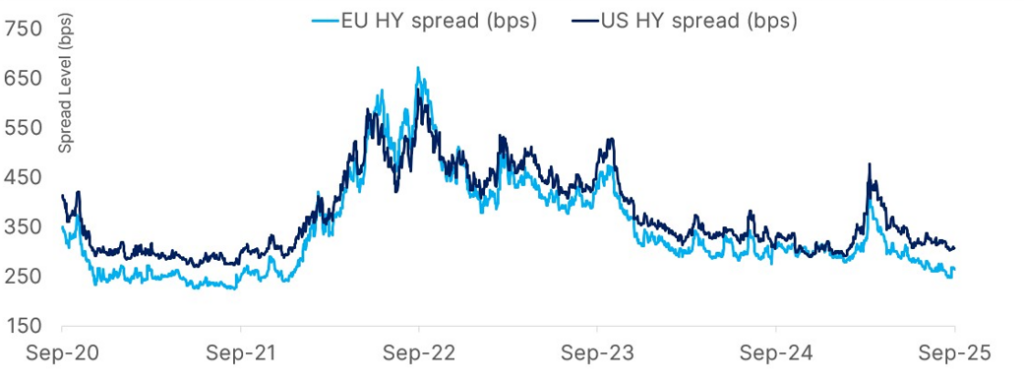
EU HY Spread vs US HY Spread. Source: Algebris Investments , Bloomberg Finance L.P. Data as of 10.09.25. Note: EU HY – ITRX XOVER CDSI GEN 5Y Corp, US HY -CDX HY CDSI GEN 5Y SPRD Corp
1 Chart 6 Note: Real rates are computed using yield data from Bloomberg and inflation expectations. For the Euro Area we have the latest 2Y inflation projections from the ECB. For US Assets we use Federal Reserve Common Inflation Expectations (CIE) Michigan Alternative. For Japanese assets we use the inflation expectations for 2027 from Bloomberg. European Banks data is computed as Dividend Yield + Share Buyback. IG e HY assets in EU and US refer to Bloomberg corporate Index. US HY is Bloomberg US Corporate High Yield Total Return Index Value Unhedged USD,
US IG is Bloomberg US Corporate Total Return Value Unhedged USD IG Index. EM Sov Credit is Bloomberg Emerging Markets Sovereign TR Index Value Unhedged USD. IG EU is Bloomberg Euro Aggregate Corporate Total Return Index Value Unhedged EU IG Index. HY EU is Bloomberg Pan-European High Yield Total Return Index Value U Hy Bond IDX.
The quest for real yields has therefore become one of credit selection. The current environment is tight but still offers dispersion. Financial institutions pay 6-7% real yields through a combination of high dividend yields and share buybacks. Subordinated credit pays almost 3%. In contrast, the free cash flow yield of S&P 500 companies is at ten-year lows and barely covers inflation. In emerging markets, high-yield credits offer 4-5% real yields despite low refinancing risks over the next two years. Local currency bonds pay real yields in the 5-10% range despite a weak USD. In corporate credit, a few solid sectors such property in Europe and utilities in the US, remained behind, especially junior bonds, which still offer 3-4% real yields.
As markets force governments to face the high debt reality, yield manipulation is set to become the new normal. Credit becomes the only (real) option for investors, but value is hard to find.
As opposed to the past three years, picking the right spot will make the difference.
For more information about Algebris and its products, or to be added to our distribution lists, please contact Investor Relations at algebrisIR@algebris.com. Visit Algebris Insights for past commentaries.
Any opinion expressed is that of Algebris, is not a statement of fact, is subject to change and does not constitute investment advice.
No reliance may be placed for any purpose on the information and opinions contained in this document or their accuracy or completeness. No representation, warranty or undertaking, express or implied, is given as to the accuracy or completeness of the information or opinions contained in this document by any of Algebris Investments, its members, employees or affiliates and no liability is accepted by such persons for the accuracy or completeness of any such information or opinions.
© Algebris Investments. Algebris Investments is the trading name for the Algebris Group.