What is financial repression? It is a set of policies resulting in savers earning returns below the rate of inflation in order to provide cheap loans to companies and governments, reducing the burden of repayments.
Over the past decade, quantitative easing boosted asset prices but failed to boost inflation. It also added to pernicious collateral effects – like corporate and household inequality – by rewarding the haves more than the have-nots.
Today, the political music is changing. The Covid-19 crisis has already highlighted the need for Western governments to not only boost growth, but also invest in social welfare, including healthcare and infrastructure and to reduce inequality. A potential Democratic win at U.S. elections could bring a shift towards helicopter money: more fiscal stimulus to states, local authorities and individuals, combined with dovish monetary policy.
One of the reasons QE failed to generate inflation was that it rewarded firstly asset owners, who already have a low propensity to spend, and was not always accompanied by fiscal stimulus. The combination of extraordinary fiscal stimulus and a Fed focused on labour market conditions and more flexible on inflation could finally generate a weaker Dollar and some inflation over the coming years.
Where does this leave the majority of bond investors? Simmering in a boiling pot, we think. Debt levels are rising in developed and emerging markets, while real yields are already well below zero. It is true that disinflationary trends are still strongly in place: demand disruption, an ageing population and the accumulation of industrial overhangs in areas of the old economy where demand is no longer as strong – like energy, retail, autos, traditional banking, commercial real estate. But at current yields, investors have no room for error. The most dangerous security to own in your portfolio is probably long-end government debt: you can either lose money slowly to inflation, or quickly if there’s a repricing of expectations.
What’s more important though, is that regardless of price action in the short term, a decade of QE has brought deep changes to the structure of financial markets. As we approach a potential turning point, investors will have to re-think their portfolios based on changes to volatility, liquidity and correlation of financial assets.
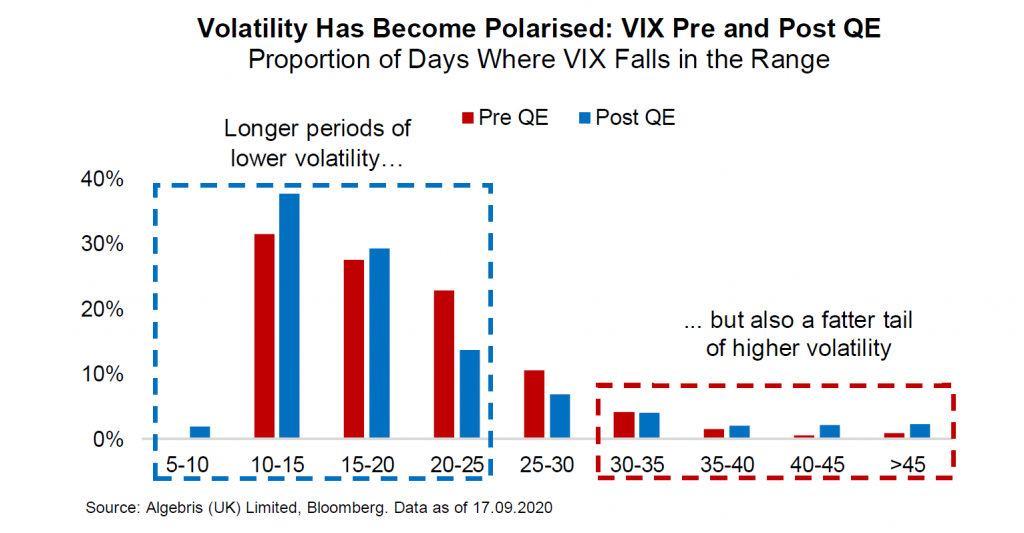
Volatility has become binary: reliance on central bank decisions as the determining factor has resulted in a fatter tailed binary structure of volatility: there are more days of sun but when there’s bad weather, it’s hurricane.
Risky and risk-free assets move in tandem: as investors second-guess central bank decisions, they often buy or sell risky and risk-free assets together. At very low government yields, leverage in balanced and risk-parity strategies has grown, making moves even more extreme.
Finally, trading liquidity has become scarcer, as bank regulations cap the amount of inventory dealers can hold, while herding and passive strategies continue to grow.
One-Way Markets: a Faustian Pact between Central Banks and Investors
Imagine an apple market. The buyers and sellers may have different views on weather conditions and demand, and eventually they will reach an equilibrium price to trade. Now, imagine a market where everyone wants to buy Monday to Wednesday and everyone is a seller for the rest of the week, anticipating the impact of the quantitative apple easing programme.
In this second scenario, price fluctuations are a lot more extreme, regardless of a change in fundamentals – this is because most people are buying or selling at the same time, based on one factor only. This is what we would call a binary market.
As central bankers moved from standard monetary policy to asset purchases and enhanced forward guidance a decade ago, they started to have a direct influence on markets. At the same time investors started to rely on them more closely.
Armed with an explicit central bank put, every year, traders buying the dip outperformed long term investors. Passive strategies grew also, together with strategies betting on volatility staying low. Herding – the percentage of investors heading the same way, increased as a result, as reported by the IMF. At the same time, bank regulators eager to shield themselves from a repeat of the last crisis constrained trading risk levels, bringing dealer inventories to a minimum.
It all worked well for markets at the onset of central bank policy action. But the problem with binary markets is that they become increasingly fragile. A market where central banks have promised good weather through forward guidance and where regulators have reduced dealer inventories, is like an open concert where no one has umbrellas and the exit doors are tiny.
Several times over the past few years, central bankers tried to withdraw the punch bowl, resulting into sharp market selloffs which threatened financial stability. During the latest attempt to normalise policy in 2018, short volatility strategies collapsed and credit spreads widened to a record. Central banks stepped back in, reversing course. But this left them with limited traditional ammunition to fight today’s pandemic. As the virus sent markets into a tailspin during the first quarter – the reaction was again more asset purchases.
Monetary policy saved risk markets one more time. Yet, it made the policy reaction function more dependent on market price action too, as the BIS wrote, potentially incentivising a series of financial boom-bust cycles. In turn, this dependence will influence investor behaviour.
How does this dependence impact the economy and financial markets?
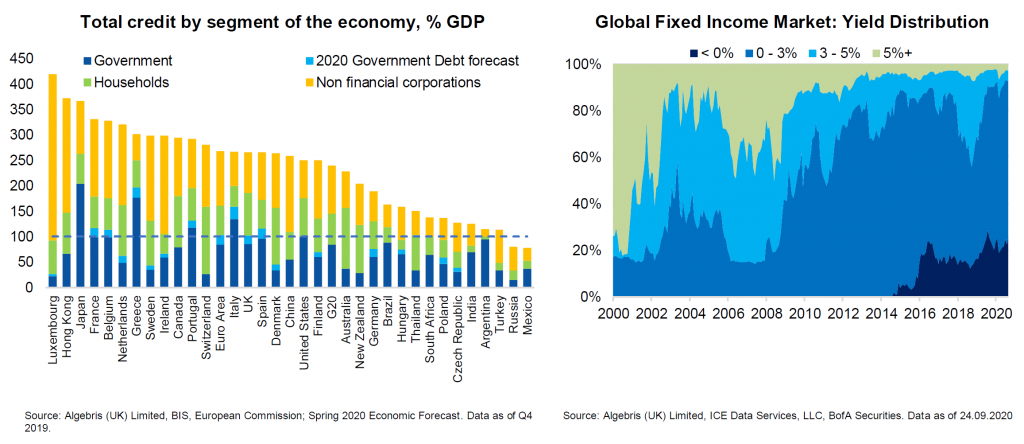
Financial Fragility: Volatility, Correlation and Liquidity
Over the past years, we discussed some of the consequences of persistent low interest rates on the economy: there are many short-term positives, like a confidence and consumption boost. However, the negatives become more apparent over time, engulfing the economy a QE infinity loop. Low interest rates keep inefficient firms alive, with the Economist recently arguing that covid stimulus may bring an “extra layer of zombification”. Other effects of persistently low interest rates are a funding advantage to large firms and an incentive for these to consolidate and acquire potential threats, which can lead to oligopolistic behaviour over time, as discussed in The Silver Bullet | The Pandemic Revolution and The Myth of Capitalism.
But let’s focus now on the structural changes to markets, and on how to navigate this new environment. Post-QE markets have different volatility, correlation and liquidity structure.
The first consequence from central banks being the only game in town, is a polarisation in the structure of volatility. Central banks have not only been able to compress risk premia, but to stabilise their movement too. The one-two punch has been asset purchases pushing risk premia lower, and enhanced forward guidance telling investors that the central bank put would always be there. The result is Faustian pact, with investors trusting the central bank put and betting that market weather would be sunny all year round. As the chart below shows, this has meant more low-volatility days throughout the year. That said, increased reliance on central bank guidance has also come with more crowded positioning. This boosts volatility in periods of uncertainty, as everyone rushes to the exit. Since the introduction of QE, volatility is usually low for a longer period than before – but much higher than before when market crashes occur.
Another key change has occurred in the way assets move against each other. The FT recently asked whether the traditional 60/40 bond/equity portfolio still has a future. In a normal, pre-QE market, risk-free assets would be typically negatively correlated to risky ones: government bonds would rise as stocks fall on bad news, and vice-versa. If central banks become the only game in town, however, investors’ bets will be on asset purchases of government debt, corporate bonds and equities – with these moving all in tandem. This means that asset correlations have turned positive, even between assets which should typically move in different directions. This is true both for daily as well as intra-day moves, as show on the left by our analysis. Today, government bond yields barely compensate for inflation risk, and they no longer provide as much mark-to-market protection either.
The final point is a reduction in trading liquidity. With investors either buying or selling all assets, second-guessing central banks, passive strategies have doubled in size, rising to half of equity funds from a quarter ten years ago. At the same time, bank regulation continued to constrain dealers’ capacity to take risk and absorb market swings with their inventory, now a fraction of the size it used to be a decade ago. The result is a fat tail of liquidity risk, particularly apparent in instruments with liquid liabilities and illiquid assets, like corporate bond ETFs, as evident during price action in the first quarter, until intervention by the Federal Reserve.
Barbells Against Bubbles
With negative real rates on government debt, fat tails in volatility and liquidity and positive correlations between risky and risk-free assets, investors need to re-think portfolio construction.
The recent experience of markets switching between central bank euphoria to fundamental panic, and back, has taught us a few lessons.
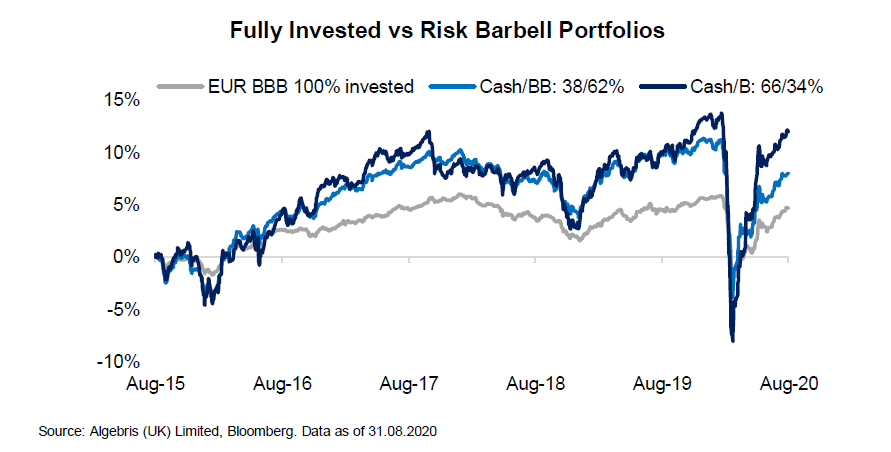
The first is to use a barbell strategy. A portfolio which is fully invested in triple-Bs, or BTPs offers little yield and no optionality in case of a sell-off. Instead, a portfolio which is a combination of cash and riskier bonds with more symmetric upside/downside can be more resilient to volatility and offer more upside, for the same yield, along the lines of what N. Taleb extensively discusses in Antifragile: Things that Gain from Disorder. Over the past few years, barbell portfolios with equal yield outperformed fully invested portfolios, on a static basis, as shown on the left. That is, excluding the option to add risk during a selloff.
The second is to value convexity. Government and corporate bonds with tight yields are put options with very negative convexity – the central bank backstop will likely be there, but if it isn’t, investors can lose a multiple of what they would normally earn – as shown by the wipe out buffer, on the left. We construct our portfolio using assets where the gains and losses are at least symmetric, irrespective of the odds. In addition, we like assets where convexity is cheap and in our favour: convertible bonds, not directly manipulated by central banks, can offer very attractive payoff profiles.
As central banks focus more directly on inflation, steeper curves may harm bonds and equities at the same time. This is what happened in the summer of 2013 or in early 2018, when pressure on long-term yields intensified at a time of economic weakness. The risk is even more pronounced at the current juncture, given the increasing weight of rates-sensitive tech stocks in major indexes.
The third point is to always keep more liquidity than needed. With binary volatility and high liquidity risk in bond markets, prices may not always reflect fundamentals, and fire-sales of high quality assets may occur more frequently than expected. In January this year, we shifted half our portfoilio in cash, which allowed us to deploy capital and buy investment grade debt cheaply during the selloff. Put differently, an always fully invested portfolio underestimates the option value of liquidity in fragile, binary markets.
Going forward, we believe anti-fragile portfolio construction may become even more important. A potential Biden victory at U.S. elections could mark a shift from the Trump administration’s focus on tax cuts and asset-based monetary policy – which has mostly benefited the top 10% of Americans – to a more broad-based fiscal stimulus. With its recent strategy review, the Federal Reserve has already shifted its gears to make labour market conditions its primary focus, while gaining flexibility on inflation. If helicopter money is coming, under the form of continued fiscal stimulus coupled with loose monetary policy, then traditional fixed income is nothing else but return free risk, as Bill Gross would put it.
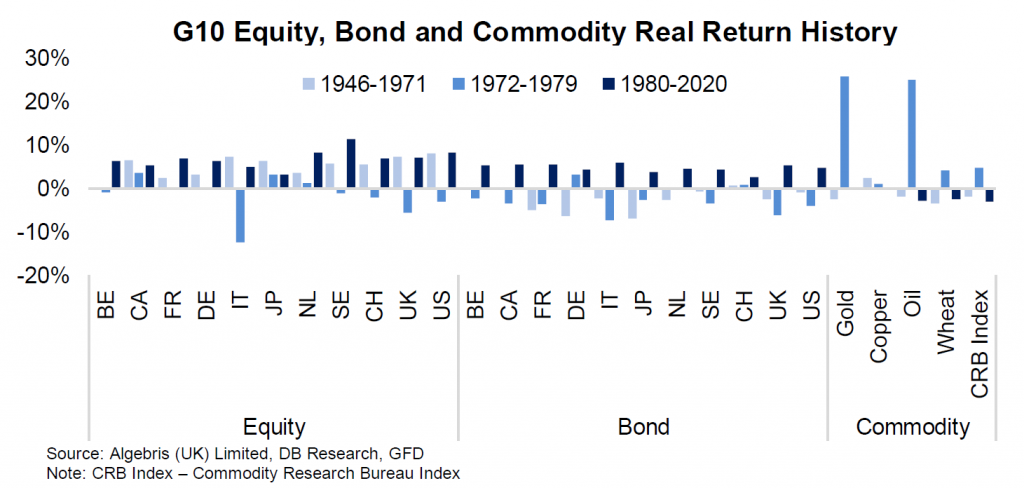
US Elections: More Spending and Financial Repression Ahead
We think Biden is favoured to win the November presidential election: our model based on adjusted state polls suggests an 82% probability for him to secure over 270 electoral votes. While there are doubts over poll reliability after the 2016 elections, we believe Biden stands in a stronger position than Clinton in 2016, with more consistent polling lead even in battleground states like Michigan, Pennsylvania and Wisconsin. In addition, a deep dive into Nationscape survey data covering 319k voters shows that about 9% of 2016 Trump voters likely have switched to Biden, while only 4% of 2016 Clinton voters had switched to Trump.
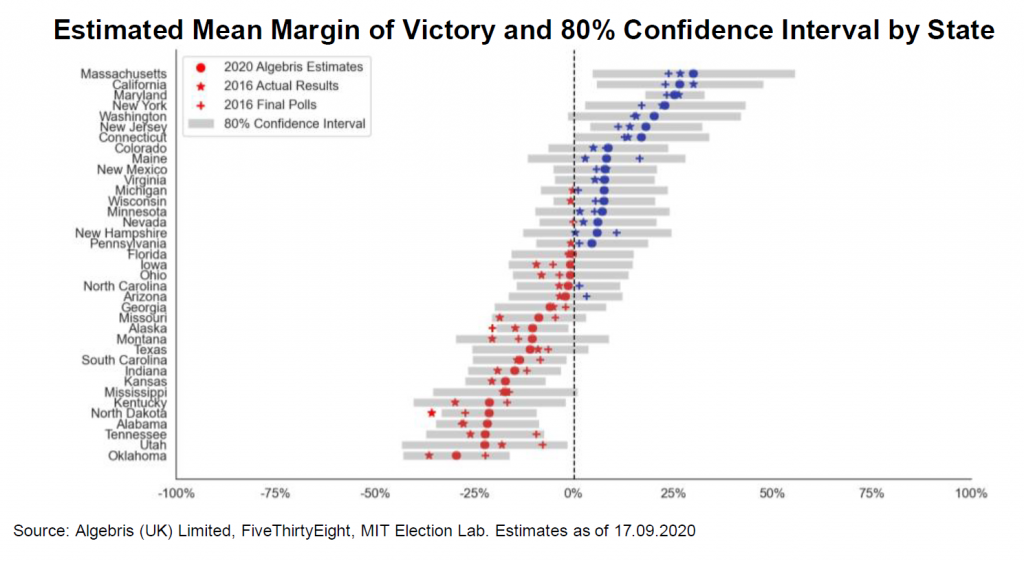
A Biden presidency will mean more stimulus to the real economy. Contrary to popular belief that a Biden victory means immediate tax hikes and a hit to risk assets, we expect limited short-term negative reaction and better long-term prospect. In our view, a Democratic government will prioritise fiscal expansion over reversing corporate tax cuts. First, we see a lower probability for a Democratic sweep. Our senate model currently indicates a 35-45% probability for Democrats to hold over 50 seats, which is far from the 60 needed to pass bipartisan legislation for controversial tax changes. Second, Biden’s economic proposals call for higher public spending on education, infrastructure and renewables, which should support job creation and boost long-term productivity. Third, a Biden administration will likely bring more certainty to the US’s foreign policy and be more supportive of international trade. The biggest risk is a potential delay in vote counts due to mail-in ballots. As shown left, a significant proportion of voters in closely contested states are likely to vote by mail, while such mail-in voters are largely skewed towards Democrats. However, recent surveys by Citi and Goldman Sachs show investors are already pricing in an elevated probability of a contested vote at over ten percent, while pricing only around 50% for a Biden victory.
More stimulus could lift inflation, pushing real rates even lower. While the Federal Reserve may be more independent under Biden, short-term rates will likely remain near their all-time lows. We think this will be the case as the Federal Reserve will emphasise the need to not just restore low unemployment but also for the job gains to be “broad-based and inclusive”. Put simply, the Federal reserve may try to use monetary policy to address inequality, even if it comes at the risk of higher inflation. And we expect inflation will be moderately higher under Biden, than it has been under Trump. Biden’s fiscal plans, unlike Trump’s corporate and personal tax-cuts, will be redistributive. Biden’s fiscal proposal calls for higher taxes on corporates and high-earners and larger allowances for first-time home buyers and lower-earners. That is, Biden’s proposal will likely put more money in the hands of lower-income earners, who historically have had a much higher propensity to spend.
Conclusions: Anti-Bubble Strategies to beat Financial Repression
The past decades have been a boon for bond investors, with central banks buying government and corporate debt to boost confidence and asset prices – yet failing to boost inflation. The music is changing: rising inequality and the covid crisis call for more broad-based policy measures to benefit the real economy, not only asset owners.
We think the upcoming U.S. election could mark a shift in policy from asset-based QE and tax cuts to helicopter money: more fiscal stimulus to individuals, small businesses and states. The combination of bottom-up stimulus and loose monetary policy may push inflation rates higher than tax cuts and asset-based QE have done so far, in our view.
With yield curves already compressed below inflation, bond investors appear as boiling frogs: deflationary trends may continue in the near-term, but political pressures to keep spending going and inflation rising are building.
In addition, financial markets have experienced increased fragility over the past few years. Investor herding in long carry and short volatility strategies, encouraged by central bank forward guidance, is pro-cyclical. This results in a binary distribution of volatility, where the music plays most of the time, but a few days where the exit is very painful and disruptive even for high-quality assets. In addition, asset correlations provide increasingly less diversification.
We believe a barbelled, dynamic portfolio of cash and a combination of credit, convertible bonds and commodities offers investors superior chances of beating the market and inflation over the coming years.
The Global Credit Opportunities strategy is positioned to benefit from a rise in fiscal stimulus and from a gradual normalisation in the economy thanks to a vaccine and to faster viral testing. Bonds in covid-hit sectors can offer substantial upside, and in some cases may benefit from government help in a downside scenario. Similarly, we believe convertible debt offers inexpensive positive convexity to a recovery in economic conditions. We avoid assets which present negative convexity, like BTPs or long-term US government debt, which provide small potential gains against large losses in a too-cold or too-hot economy where spreads or rates would widen.

Appendix I. Comparing Barbell Strategies vs Fully Invested Portfolios
To evaluate the effectiveness of various portfolios in times of market pressure, we compare two fully invested strategies, a long BTPs and a long Euro BBB portfolio, vs three risk barbell alternatives with similar yield (30% cash & 70% EUR B, 30% cash & 70% EM sovereign, 50% cash & 50% EUR BB). We estimate performance of the strategies in 2017 and in 2018. We selected these two years as example years of a bull and bear market, respectively.
The superior risk-adjusted performance of a barbell portfolio is clear vs a BBB- only or BTP-only portfolio, as seen on the chart on the left. In 2017, the two riskiest barbells (EM debt and EUR B) delivered 6% returns vs 0% of BTPs. In 2018, the riskiest barbell portfolios lost around 3.5% each but BTPs lost 2.3%. Also, the volatility of the barbell portfolio was in line with that of the BBB portfolio: a 50-50 cash-BB portfolio delivered the same drawdown as a fully invested BBB strategy, with volatility only 1pp higher. Risk metrics worsen materially if we look at not diversified allocations, like a portfolio which is long-only in BTPs.
Finally, we should note that the above simulations are all run in their passive versions. In fact, cash has option value by allowing investors to add risk on pullbacks. The small difference in returns between the fully invested portfolios of BTPs, triple-BBB and the barbells suggest a low bar for active management to add value. A 2% alpha would be enough to beat BTP in 2018. Considering that moving 10% cash into risk on a 5% pullback could be worth 50bp, the option value of cash easily makes barbells superior to passive fully invested strategies.
In addition to offering less optionality vs barbells, fully invested strategies in “low-risk” bonds are also exposed to more duration risk. This has worked well over the past decades, but may no longer work out in the future, as discussed above.
A fully-invested portfolio in safer triple-B or double-B assets will have a higher sensitivity to rising inflation than a barbell of cash and riskier single-B debt, despite a similar yield. The former are mechanically less protected against inflation despite higher sensitivity to such risk. The historical beta of 10-year BTPs to inflation, for example, is 1.1 vs 0.X for high yield credit. Based on historical betas, a 1% increase in global inflation over a twelve-month timespan could lead to an 8% nominal loss in BTPs, compared to a 2% loss in the cash-HY barbell portfolio. The loss becomes even starker considering BTPs, or investment grade credit, yields less even less today.
In summary, while fully invested portfolios in higher rated debt offer apparent security, they expose investors to negative convexity and a lack of optionality in drawdowns. The vast majority of BB credits globally now offer 4-4.5% yield and leave investors exposed to market beta. Other asset classes, such as convertible debt or low cash-price high yield debt offers high coupons.
Appendix II. Modelling US Elections
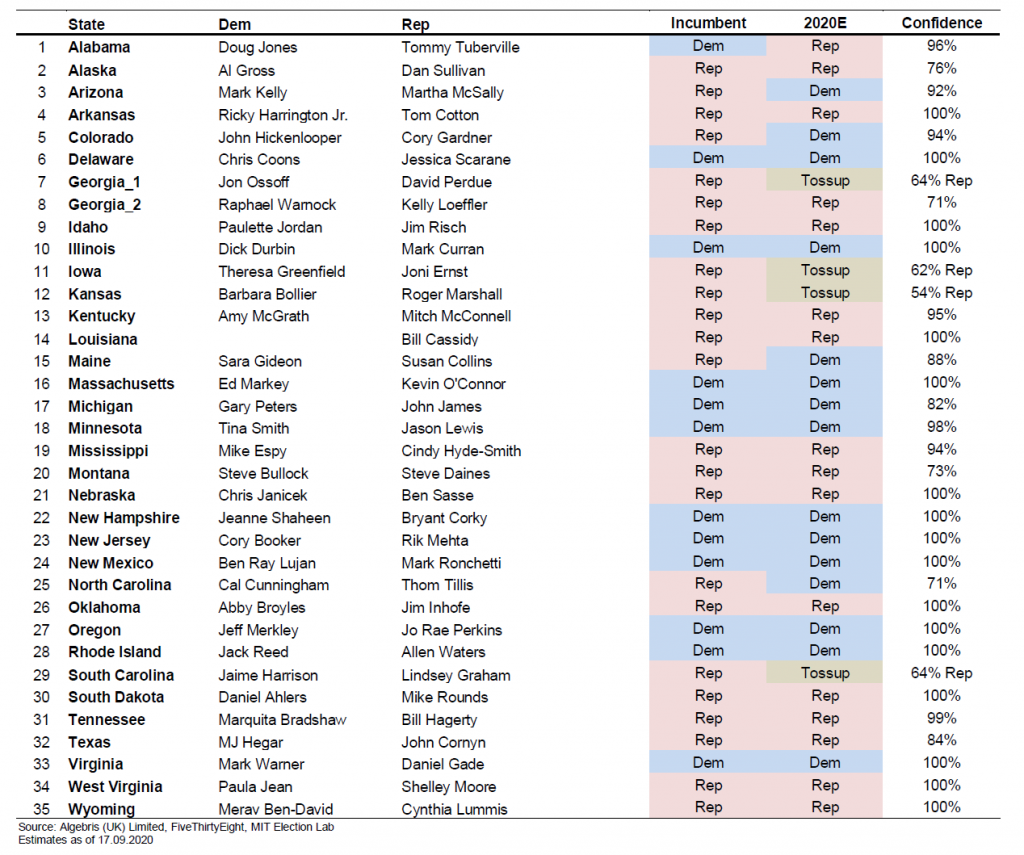
Senate Election Model Forecasts
35 seats will be contested on 3 November. The rest of uncontested seats include 33 Democrats, 30 Republicans and 2 Independents.
US Election Model Methodology
Presidential Election: For each state, 10,000 simulations were run to compute potential election outcomes, assuming the %vote of each candidate follows a normal distribution.
The mean of the distribution was computed by taking the average of the last five state polls (only including polls conducted in 2020), adjusted for historical state partisan lean and mail-in rules. The standard deviation was computed as 3x standard deviation of all 2020 polls for that state. Undecided voters were randomly assigned to either candidate.
For historical state partisan lean adjustments, the average lead/lag by Democrats over Republicans in each state was compiled for 2008, 2012 and 2016 elections. The averages of the past three elections were again averaged with the latest poll lead/lag to adjust the state means used in simulations.
States with more difficult mail-in rules were assumed to benefit Trump more. For states where everyone can vote by mail but neither ballots nor mail-ballot applications are automatically mailed to voters, 1pp was added to Trump’s latest poll ratings and 1pp was deducted from Biden’s. For states where people can only vote by mail if they have a valid excuse (Covid does not count), 2pp was added/deducted.
Senate Election: The methodology is like the presidential election, using latest by-state senate poll averages and standard deviations as model parameters.
For more information about Algebris and its products, or to be added to our distribution lists, please contact Investor Relations at algebrisIR@algebris.com. Visit Algebris Insights for past commentaries.
This document is issued by Algebris Investments. It is for private circulation only. The information contained in this document is strictly confidential and is only for the use of the person to whom it is sent. The information contained herein may not be reproduced, distributed or published by any recipient for any purpose without the prior written consent of Algebris Investments.
The information and opinions contained in this document are for background purposes only, do not purport to be full or complete and do not constitute investment advice. Algebris Investments is not hereby arranging or agreeing to arrange any transaction in any investment whatsoever or otherwise undertaking any activity requiring authorisation under the Financial Services and Markets Act 2000. This document does not constitute or form part of any offer to issue or sell, or any solicitation of an offer to subscribe or purchase, any investment nor shall it or the fact of its distribution form the basis of, or be relied on in connection with, any contract therefore.
No reliance may be placed for any purpose on the information and opinions contained in this document or their accuracy or completeness. No representation, warranty or undertaking, express or implied, is given as to the accuracy or completeness of the information or opinions contained in this document by any of Algebris Investments, its members, employees or affiliates and no liability is accepted by such persons for the accuracy or completeness of any such information or opinions.
This document is being communicated by Algebris Investments only to persons to whom it may lawfully be issued under The Financial Services and Markets Act 2000 (Financial Promotion) Order 2005 including persons who are authorised under the Financial Services and Markets Act 2000 of the United Kingdom (the “Act”), certain persons having professional experience in matters relating to investments, high net worth companies, high net worth unincorporated associations and partnerships, trustees of high value trusts and persons who qualify as certified sophisticated investors. This document is exempt from the prohibition in Section 21 of the Act on the communication by persons not authorised under the Act of invitations or inducements to engage in investment activity on the ground that it is being issued only to such types of person. This is a marketing document.
The distribution of this document may be restricted in certain jurisdictions. The above information is for general guidance only, and it is the responsibility of any person or persons in possession of this document to inform themselves of, and to observe, all applicable laws and regulations of any relevant jurisdiction. This document is suitable for professional investors only. Algebris Group comprises Algebris (UK) Limited, Algebris Investments (Ireland) Limited, Algebris Investments (US) Inc. Algebris Investments (Asia) Limited, Algebris Investments K.K. and other non-regulated companies such as special purposes vehicles, general partner entities and holding companies.
© Algebris Investments. Algebris Investments is the trading name for the Algebris Group.


