


Peace Dividend
Building on a year already defined by geopolitical risk and AI excitement, equity markets pushed higher through the period, with the long-running US-Iran ceasefire negotiations finally crystallising into a framework agreement that resulted in the (temporary) reopening of the Strait of Hormuz and pulled oil sharply lower. The relief rally was global, but Asia led emphatically. Japan and Korea, already the strongest performers year-to-date, both surged to fresh record highs, with the Nikkei and KOSPI posting outsized single-session gains driven by strength in the semiconductor and AI infrastructure complex. In the US, SpaceX’s record Nasdaq debut on 12th June, soaring 19% on its first day in the largest IPO in market history, added to the buoyant mood, and the S&P 500 pushed to fresh records. The Federal Reserve injected the period’s main note of caution as new Fed Chair Kevin Warsh signalled a hawkish shift, with the dot plot now pointing to a possible hike this year, prompting a brief sell-off before equities recovered. Europe also rebounded strongly given its higher energy import dependency, despite more limited exposure to the AI theme driving other major markets, while a hawkish ECB delivered its first hike of the cycle as eurozone inflation pushed higher. Year-to-date, Asia continues to lead by a wide margin, led by Korea and Taiwan, but both the United States and Europe remain firmly positive.
Source: Algebris Investments, Bloomberg Finance L.P, data as of 22/06/2026. Performances in local currencies
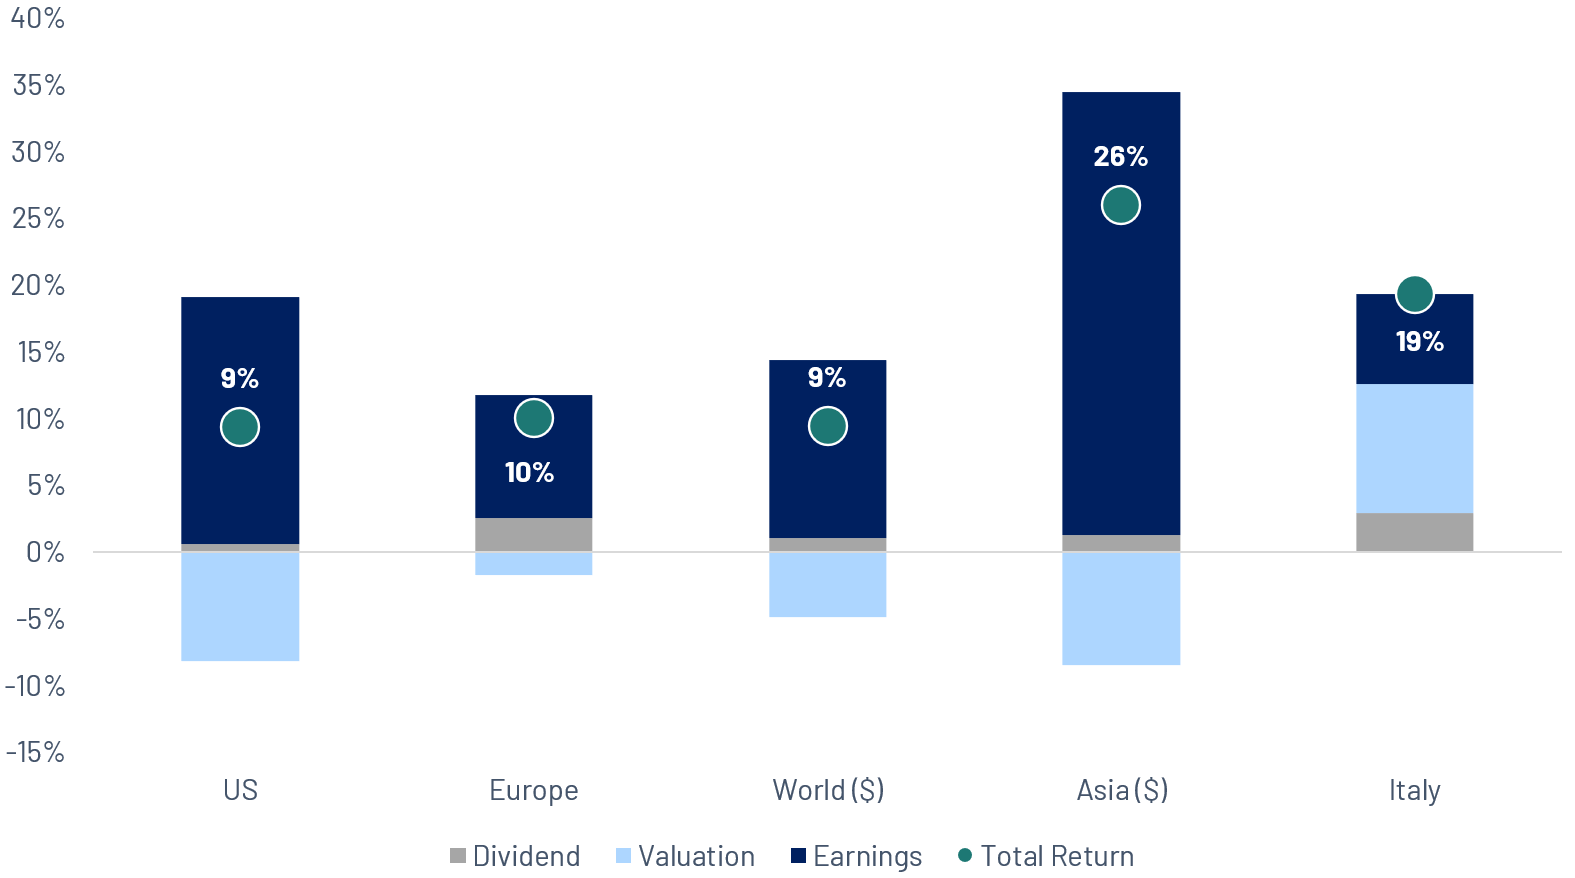
Earnings gravity, everything else is just volatility
There is a simple truth buried beneath the daily noise of markets: over the long run, stock prices follow earnings. Not sentiment, not monetary policy. The data is unambiguous. Over the past 30 years, EPS growth in the S&P 500 has tracked index performance with a correlation of roughly 97%. Stocks are claims on future profits, and the market cannot indefinitely reprice those claims away from underlying reality. Europe tells a slightly different story. The EURO STOXX 600 shows a lower correlation (around 76%) between EPS growth and price performance. The gap is largely explained by index composition: European markets carry a much heavier weight in dividend-paying sectors, so a significant share of total return comes through distributions rather than capital appreciation. In the short run, prices gyrate on rate expectations, liquidity cycles, and sentiment. A company can post record profits and watch its stock fall on a single Fed comment. But that noise tends to mean-revert. Price and value may diverge for months or even years, earnings gravity always pulls them back together. This is why the short run belongs to traders, and the long run belongs to investors. Valuations matter enormously but they are a function of narrative, not fundamentals. Multiples expand in optimism and contract in fear, driven by rates, sentiment, and the story the market tells itself at any given moment. Across cycles, they mean revert. What compounds are earnings. If stock prices are ultimately a function of earnings growth, then the work of investing becomes clearer. Ignore the quarterly macro noise. Focus on the quality and trajectory of corporate profits. Understand why a company grows: pricing power, market share, operating leverage, capital allocation discipline, and the competitive landscape. Identify structural trends that create multi-year earnings tailwinds and own the best-positioned businesses within them.
The Valuation that defies the spreadsheet
On June 12 2026, SpaceX went public on Nasdaq. The stock rose 19% on its first day, valuing the company above $2 trillion, the biggest IPO in history, raising $75 billion. Within days, it had surpassed Amazon in market cap. Pause on that comparison. Amazon generates $742 billion in revenue and $78 billion in net income. It runs the world’s dominant cloud, a global logistics empire, and the third-largest digital ad business on the planet. The spreadsheet screams Amazon. SpaceX made $18.7 billion in revenue in 2025 and lost $4.94 billion. On any traditional metric, EV/Sales, EV/EBITDA, P/E, SpaceX trades at multiples that make Amazon look like a value stock. And yet the market says SpaceX. Because markets don’t price what a company is now. They price what it could potentially become. Starlink has reached 10 million subscribers. The launch business is a near-monopoly. Musk has suggested $1 trillion in revenue by 2030. Investors are buying the trajectory, not the trailing numbers. There is also a free float issue worth noting: only a fraction of shares are publicly traded, which amplifies price moves and should temper any read-through on intrinsic value. For investors, the question is not whether SpaceX deserves a $2 trillion valuation today. It almost certainly does not, by any conventional measure. The question is whether the story being sold, a trillion dollars in revenue by 2030, satellite internet for the world, humans on Mars, is worth owning a piece of, at whatever price the market clears.
The Leverage Stays on Their Balance Sheet. The Growth Lands in Ours
In all of 2025, the five largest hyperscalers issued $121 billion in US corporate bonds, against an average of $28 billion per year between 2020 and 2024. In H1 2026 alone they have already issued $169 billion, with capex plans reaching $775 billion for the year. Why debt? Why now?
- The cash flow math has changed: capex now consumes nearly 100% of operating cash flow, up from 40% historically. When capex exceeds FCF, you tap the bond market.
- Rates: most issuance has been priced below 5%, and with $700B+ of infrastructure to finance over decades, locking in long-dated paper now is rational treasury management.
- Timing: the shift from cash-funded to debt-funded is structurally late in the cycle, not early. Phase one was equity funded. Phase two is debt. Phase three, if demand doesn’t convert to revenue fast enough, would be distress.
Is this visionary or expensive? The big four (Alphabet, Amazon, Meta, Microsoft) entered this cycle with leverage below 1x and are aggressive but defensible. Oracle is not: FCF was negative $23.7B in FY2026, capex overshot its own guidance by $5.7B, and its 5-year CDS has tripled since September. The AI super cycle is no longer funded by internet-era profits. It is now subject to credit spreads, rate cycles, and investor patience. The race is real. So is the leverage. This is precisely why we don’t hold any of these names. We invest in the picks-and-shovels layer (infrastructure, power, cooling, networking, software tooling), businesses that capture hyperscaler spending as revenue, convert it into strong EPS growth, and stay solidly free-cash-flow positive. The leverage stays on their balance sheets. The earnings growth lands in ours.
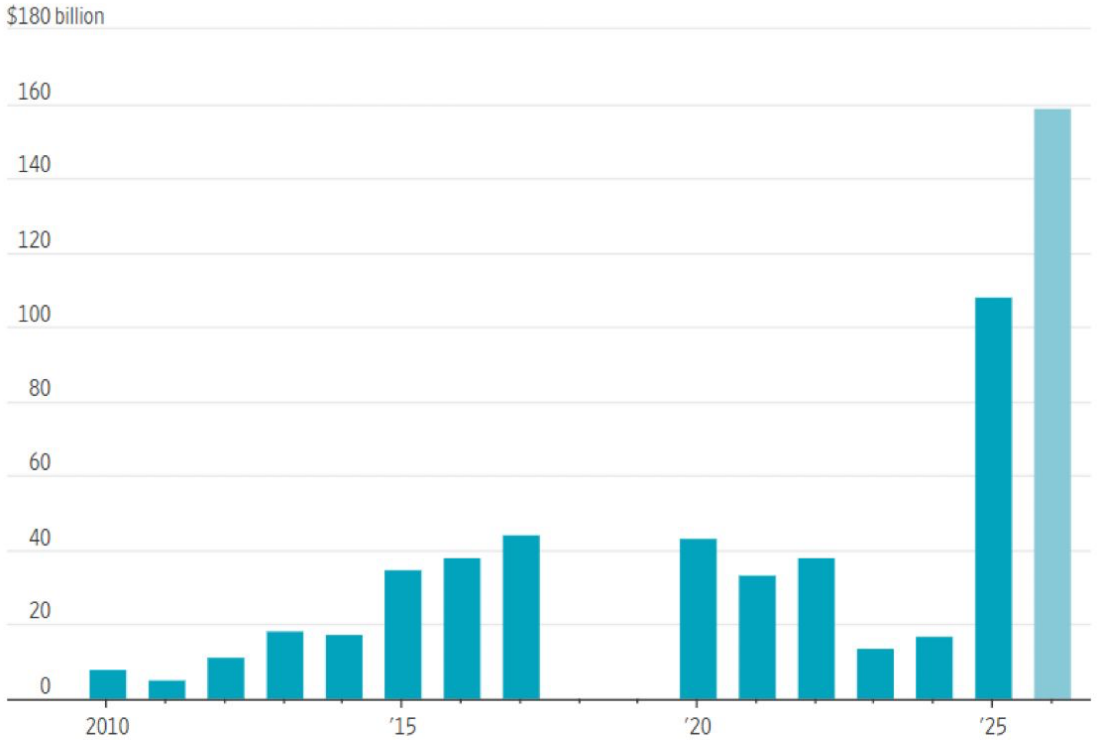
Note: Comprises bonds issued by Alphabet, Amazon, Meta, Microsoft and Oracle. 2026 data is through June 5. Source: Dealogic
Algebris Investments’ Global Equity Team
For more information about Algebris and its products, or to be added to our distribution lists, please contact Investor Relations at algebrisIR@algebris.com. Visit Algebris Insights for past commentaries.
Any opinion expressed is that of Algebris, is not a statement of fact, is subject to change and does not constitute investment advice.
No reliance may be placed for any purpose on the information and opinions contained in this document or their accuracy or completeness. No representation, warranty or undertaking, express or implied, is given as to the accuracy or completeness of the information or opinions contained in this document by any of Algebris Investments, its members, employees or affiliates and no liability is accepted by such persons for the accuracy or completeness of any such information or opinions.
© Algebris Investments. Algebris Investments is the trading name for the Algebris Group.
